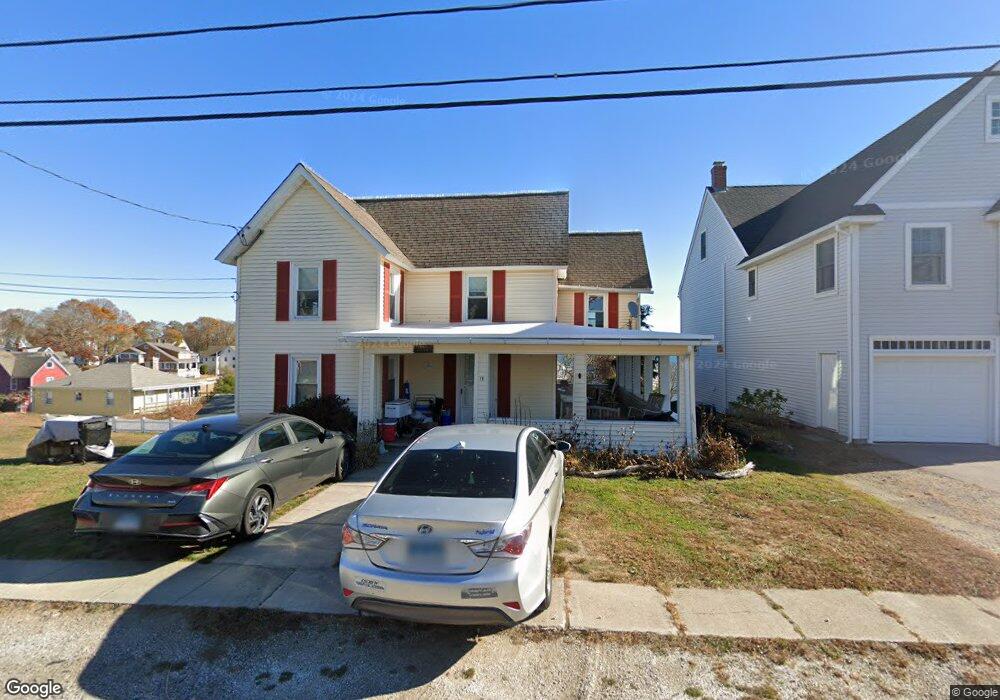
18 Bayview Ave Niantic, CT 06357
Niantic NeighborhoodEstimated Value: $742,000 - $940,000
1
Bed
1
Bath
2,155
Sq Ft
$368/Sq Ft
Est. Value
About This Home
This home is located at 18 Bayview Ave, Niantic, CT 06357 and is currently estimated at $793,289, approximately $368 per square foot. 18 Bayview Ave is a home located in New London County with nearby schools including East Lyme Middle School, East Lyme High School, and The Light House Voc-Ed Center.
Ownership History
Date
Name
Owned For
Owner Type
Purchase Details
Closed on
Jan 4, 2012
Sold by
Papas Cottage Llc
Bought by
Ferrigno Russell J
Current Estimated Value
Home Financials for this Owner
Home Financials are based on the most recent Mortgage that was taken out on this home.
Original Mortgage
$131,200
Interest Rate
3.98%
Create a Home Valuation Report for This Property
The Home Valuation Report is an in-depth analysis detailing your home's value as well as a comparison with similar homes in the area
Home Values in the Area
Average Home Value in this Area
Purchase History
| Date | Buyer | Sale Price | Title Company |
|---|---|---|---|
| Ferrigno Russell J | $164,000 | -- |
Source: Public Records
Mortgage History
| Date | Status | Borrower | Loan Amount |
|---|---|---|---|
| Open | Ferrigno Russell J | $117,000 | |
| Closed | Ferrigno Russell J | $50,000 | |
| Closed | Ferrigno Russell J | $150,000 | |
| Closed | Ferrigno Russell J | $131,200 |
Source: Public Records
Tax History
| Year | Tax Paid | Tax Assessment Tax Assessment Total Assessment is a certain percentage of the fair market value that is determined by local assessors to be the total taxable value of land and additions on the property. | Land | Improvement |
|---|---|---|---|---|
| 2025 | $10,690 | $381,640 | $223,580 | $158,060 |
| 2024 | $10,056 | $381,640 | $223,580 | $158,060 |
| 2023 | $9,495 | $381,640 | $223,580 | $158,060 |
| 2022 | $9,098 | $381,640 | $223,580 | $158,060 |
| 2021 | $8,933 | $313,320 | $213,430 | $99,890 |
| 2020 | $8,433 | $297,360 | $213,430 | $83,930 |
| 2019 | $8,383 | $297,360 | $213,430 | $83,930 |
| 2018 | $8,133 | $297,360 | $213,430 | $83,930 |
| 2017 | $7,779 | $297,360 | $213,430 | $83,930 |
| 2016 | $8,706 | $343,280 | $264,180 | $79,100 |
| 2015 | $8,482 | $343,280 | $264,180 | $79,100 |
| 2014 | $8,249 | $343,280 | $264,180 | $79,100 |
Source: Public Records
Map
Nearby Homes
- 42 S Washington Ave
- 468 Main St Unit 318
- 468 Main St Unit 111
- 127 Black Point Rd Unit 7
- 47 Village Crossing Unit 47
- 46 Village Crossing Unit 46
- 36 Attawan Rd
- 26 Mohawk Dr
- 185 Main St Unit 301
- 185 Main St Unit 305
- 97 W Main St Unit 36
- 19 Sapia Dr
- 86 Corey Ln
- 37 Stoneywood Dr
- 12 Spinnaker Dr
- 61 Whitecap Rd
- 43 Roxbury Ct
- 55 Corey Ln
- 47 Oswegatchie Hills Rd
- 31 Regatta Dr
Your Personal Tour Guide
Ask me questions while you tour the home.