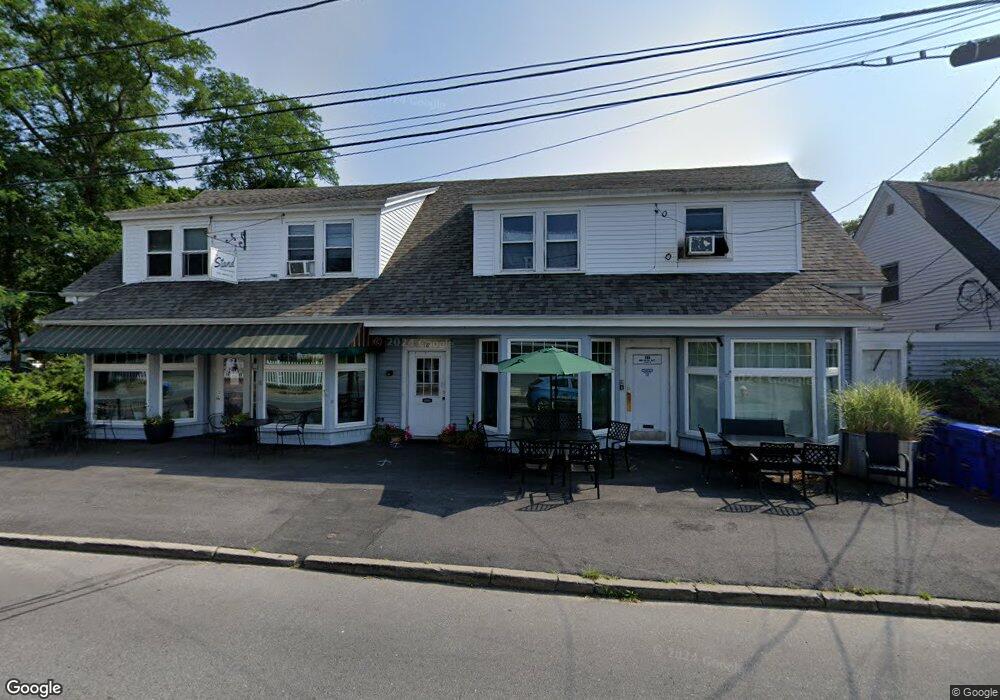
18 Beach St Bourne, MA 2532
Monument Beach NeighborhoodEstimated Value: $589,482
Studio
--
Bath
3,696
Sq Ft
$159/Sq Ft
Est. Value
About This Home
This home is located at 18 Beach St, Bourne, MA 2532 and is currently estimated at $589,482, approximately $159 per square foot. 18 Beach St is a home located in Barnstable County with nearby schools including Bourne High School, St Margaret Regional School, and Cadence Academy Preschool - Bourne.
Ownership History
Date
Name
Owned For
Owner Type
Purchase Details
Closed on
Dec 29, 2008
Sold by
Palazesi Diane P and Palazesi Leni J
Bought by
Riverbend Holdings Llc
Current Estimated Value
Purchase Details
Closed on
Jun 9, 2000
Sold by
Haskell Robert A and Haskell Cynthia M
Bought by
Palazesi Leni J and Palazesi Diane P
Purchase Details
Closed on
Jan 22, 1992
Sold by
Buck Leonard W
Bought by
Cape Cod B and Cape T
Create a Home Valuation Report for This Property
The Home Valuation Report is an in-depth analysis detailing your home's value as well as a comparison with similar homes in the area
Home Values in the Area
Average Home Value in this Area
Purchase History
| Date | Buyer | Sale Price | Title Company |
|---|---|---|---|
| Riverbend Holdings Llc | -- | -- | |
| Riverbend Holdings Llc | -- | -- | |
| Palazesi Leni J | $148,000 | -- | |
| Palazesi Leni J | $148,000 | -- | |
| Cape Cod B | $110,000 | -- |
Source: Public Records
Mortgage History
| Date | Status | Borrower | Loan Amount |
|---|---|---|---|
| Previous Owner | Cape Cod B | $30,000 |
Source: Public Records
Tax History
| Year | Tax Paid | Tax Assessment Tax Assessment Total Assessment is a certain percentage of the fair market value that is determined by local assessors to be the total taxable value of land and additions on the property. | Land | Improvement |
|---|---|---|---|---|
| 2025 | $4,355 | $557,600 | $334,900 | $222,700 |
| 2024 | $4,259 | $531,000 | $318,900 | $212,100 |
| 2023 | $4,499 | $510,700 | $306,700 | $204,000 |
| 2022 | $4,731 | $468,900 | $288,300 | $180,600 |
| 2021 | $4,894 | $454,400 | $279,900 | $174,500 |
| 2020 | $4,793 | $446,300 | $274,500 | $171,800 |
| 2019 | $4,574 | $435,200 | $269,100 | $166,100 |
| 2018 | $4,349 | $412,600 | $258,700 | $153,900 |
| 2017 | $4,222 | $409,900 | $256,100 | $153,800 |
| 2016 | $4,187 | $412,100 | $256,100 | $156,000 |
| 2015 | $4,150 | $412,100 | $256,100 | $156,000 |
Source: Public Records
Map
Nearby Homes
- 566 Shore Rd
- 203 County Rd
- 35 Benedict Rd
- 16 Amberwood Ct
- 13 Laurel Hill Ct
- 12 Turnberry Rd Unit 12
- 5 Harbor Hill Dr
- 4 Harbor Hill Dr
- 2 Applewood Ct
- 20 Colony Ave
- 5 Sea Knoll Ct
- 5 Zoli Ln
- 14 Navajo Rd
- 4 Hollyhock Knoll Ct Unit 4
- 4 Hollyhock Knoll Ct Unit 4
- 60 Bourne Neck Dr
- 709 County Rd
- 44 Cotuit Rd
- 254 Barlows Landing Rd
- 3 1st St
Your Personal Tour Guide
Ask me questions while you tour the home.