
Seller's Agent in 2018
Bryce Lingo
Jack Lingo - Rehoboth
(302) 226-6417
23 in this area
345 Total Sales
Estimated Value: $336,332 - $2,187,000
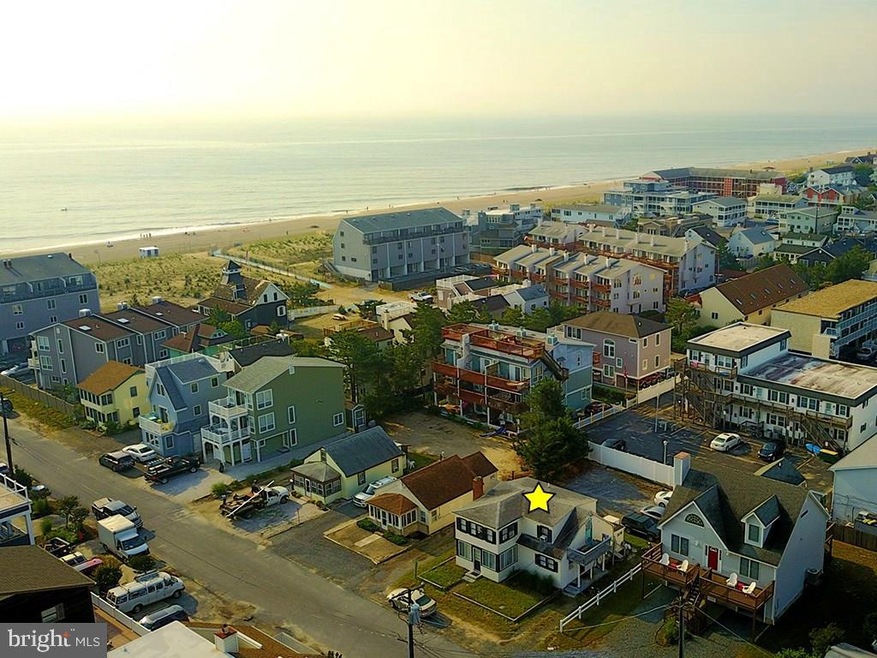
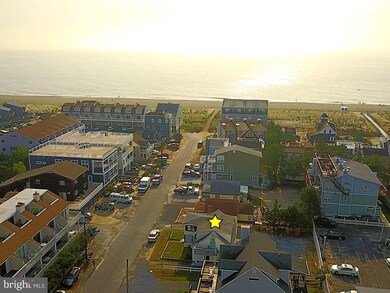
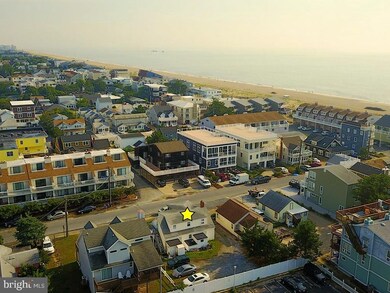
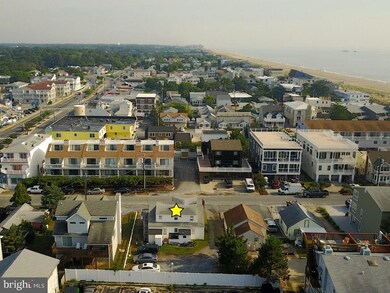
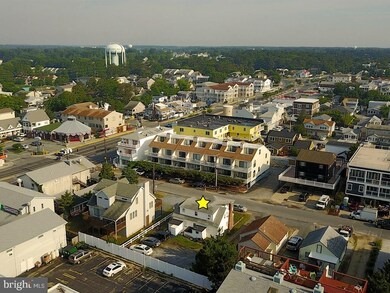
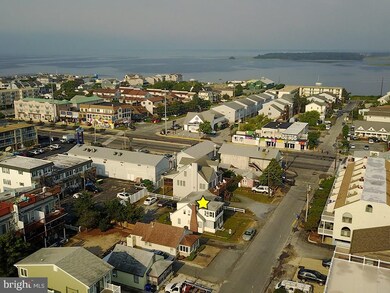
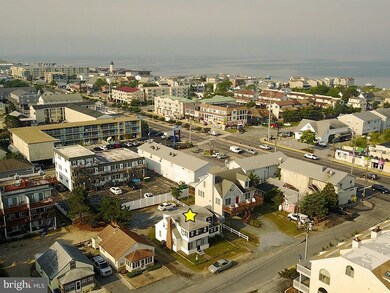
Enjoy ocean views and breezes from this excellent ocean block location!
Last Agent to Sell the Property
(302) 226-6417 bryce@rbre.com Jack Lingo - Rehoboth License #RA-0001746 Listed on: 10/23/2017
| Date | Buyer | Sale Price | Title Company |
|---|---|---|---|
| Owen Lesley C | -- | None Available | |
| Owen Lesley C | -- | None Available | |
| Owen James W | $338,000 | -- |
| Date | Status | Borrower | Loan Amount |
|---|---|---|---|
| Open | Owen Lesley C | $445,000 | |
| Closed | Owen Lesley C | $445,000 |
| Date | Event | Price | Change | Sq Ft Price |
|---|---|---|---|---|
| 01/12/2018 01/12/18 | Sold | $1,050,000 | -12.4% | $353 / Sq Ft |
| 10/23/2017 10/23/17 | Pending | -- | -- | -- |
| 10/23/2017 10/23/17 | For Sale | $1,199,000 | -- | $403 / Sq Ft |
| Year | Tax Paid | Tax Assessment Tax Assessment Total Assessment is a certain percentage of the fair market value that is determined by local assessors to be the total taxable value of land and additions on the property. | Land | Improvement |
|---|---|---|---|---|
| 2025 | $2,144 | $12,050 | $5,500 | $6,550 |
| 2024 | $912 | $12,050 | $5,500 | $6,550 |
| 2023 | $912 | $12,050 | $5,500 | $6,550 |
| 2022 | $891 | $12,050 | $5,500 | $6,550 |
| 2021 | $777 | $12,050 | $5,500 | $6,550 |
| 2020 | $883 | $12,050 | $5,500 | $6,550 |
| 2019 | $863 | $12,050 | $5,500 | $6,550 |
| 2018 | $529 | $12,050 | $0 | $0 |
| 2017 | $507 | $12,050 | $0 | $0 |
| 2016 | $510 | $12,050 | $0 | $0 |
| 2015 | $488 | $12,050 | $0 | $0 |
| 2014 | $485 | $12,050 | $0 | $0 |
Seller's Agent in 2018
Bryce Lingo
Jack Lingo - Rehoboth
(302) 226-6417
23 in this area
345 Total Sales
Seller Co-Listing Agent in 2018
Shaun Tull
Jack Lingo - Rehoboth
(302) 226-6417
28 in this area
275 Total Sales
Buyer's Agent in 2018
Sherri Martin
Jack Lingo - Rehoboth
(302) 226-6622
1 in this area
16 Total Sales
Source: Bright MLS
MLS Number: 1001034198
APN: 334-20.18-155.00
Disclaimer: Certain information contained herein is derived from information provided by parties other than Homes.com. All information provided is deemed reliable, but is not guaranteed to be accurate and should be independently verified.
![]() The data relating to real estate for sale on this website appears in part through the BRIGHT Internet Data Exchange program, a voluntary cooperative exchange of property listing data between licensed real estate brokerage firms, and is provided by BRIGHT through a licensing agreement.
The data relating to real estate for sale on this website appears in part through the BRIGHT Internet Data Exchange program, a voluntary cooperative exchange of property listing data between licensed real estate brokerage firms, and is provided by BRIGHT through a licensing agreement.
Listing information is from various brokers who participate in the Bright MLS IDX program and not all listings may be visible on the site.
The property information being provided on or through the website is for the personal, non-commercial use of consumers and such information may not be used for any purpose other than to identify prospective properties consumers may be interested in purchasing.
Some properties which appear for sale on the website may no longer be available because they are for instance, under contract, sold or are no longer being offered for sale.
Property information displayed is deemed reliable but is not guaranteed.
Copyright 2025 Bright MLS, Inc.