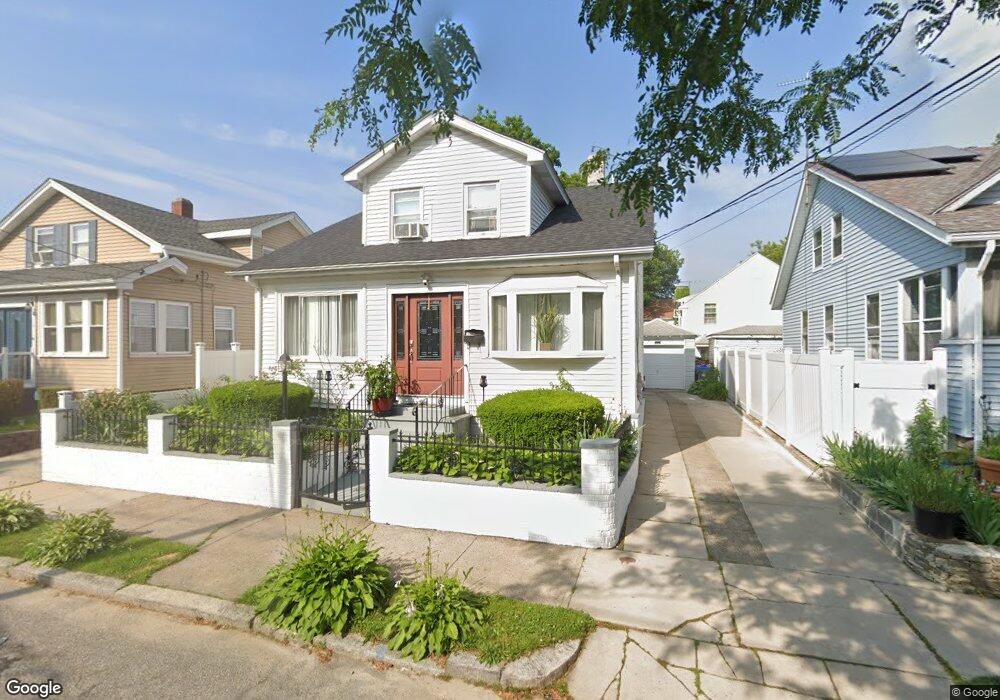
18 Bernard St Providence, RI 02905
Washington Park NeighborhoodEstimated Value: $391,436 - $428,000
4
Beds
2
Baths
1,622
Sq Ft
$252/Sq Ft
Est. Value
About This Home
This home is located at 18 Bernard St, Providence, RI 02905 and is currently estimated at $408,859, approximately $252 per square foot. 18 Bernard St is a home located in Providence County with nearby schools including Asa Messer Elementary School, Charles N. Fortes Elementary School, and Alan Shawn Feinstein Elementary.
Ownership History
Date
Name
Owned For
Owner Type
Purchase Details
Closed on
Jul 6, 1989
Sold by
Grennan Helen L
Bought by
Gomes Domingos
Current Estimated Value
Home Financials for this Owner
Home Financials are based on the most recent Mortgage that was taken out on this home.
Original Mortgage
$85,738
Interest Rate
10.38%
Create a Home Valuation Report for This Property
The Home Valuation Report is an in-depth analysis detailing your home's value as well as a comparison with similar homes in the area
Home Values in the Area
Average Home Value in this Area
Purchase History
| Date | Buyer | Sale Price | Title Company |
|---|---|---|---|
| Gomes Domingos | $85,300 | -- |
Source: Public Records
Mortgage History
| Date | Status | Borrower | Loan Amount |
|---|---|---|---|
| Open | Gomes Domingos | $67,753 | |
| Closed | Gomes Domingos | $33,500 | |
| Closed | Gomes Domingos | $85,738 |
Source: Public Records
Tax History Compared to Growth
Tax History
| Year | Tax Paid | Tax Assessment Tax Assessment Total Assessment is a certain percentage of the fair market value that is determined by local assessors to be the total taxable value of land and additions on the property. | Land | Improvement |
|---|---|---|---|---|
| 2025 | $3,105 | $369,700 | $118,800 | $250,900 |
| 2024 | $4,964 | $270,500 | $75,300 | $195,200 |
| 2023 | $4,964 | $270,500 | $75,300 | $195,200 |
| 2022 | $4,815 | $270,500 | $75,300 | $195,200 |
| 2021 | $3,861 | $157,200 | $33,200 | $124,000 |
| 2020 | $3,861 | $157,200 | $33,200 | $124,000 |
| 2019 | $3,861 | $157,200 | $33,200 | $124,000 |
| 2018 | $3,279 | $102,600 | $30,200 | $72,400 |
| 2017 | $3,279 | $102,600 | $30,200 | $72,400 |
| 2016 | $3,279 | $102,600 | $30,200 | $72,400 |
| 2015 | $3,015 | $91,100 | $30,200 | $60,900 |
| 2014 | $3,075 | $91,100 | $30,200 | $60,900 |
| 2013 | $3,075 | $91,100 | $30,200 | $60,900 |
Source: Public Records
Map
Nearby Homes