Estimated Value: $631,000 - $719,000
2
Beds
1
Bath
1,074
Sq Ft
$628/Sq Ft
Est. Value
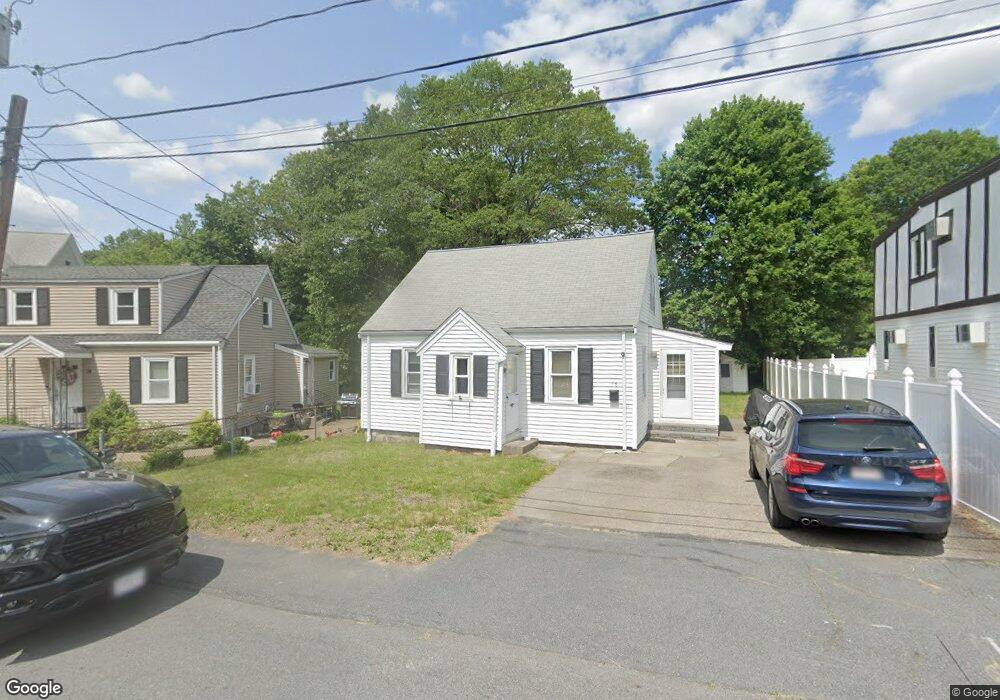
About This Home
This home is located at 18 Bonad Rd, West Roxbury, MA 02132 and is currently estimated at $674,175, approximately $627 per square foot. 18 Bonad Rd is a home located in Suffolk County with nearby schools including Catholic Memorial School.
Ownership History
Date
Name
Owned For
Owner Type
Purchase Details
Closed on
Dec 4, 2014
Sold by
Finn Carl S
Bought by
Finn Carl S and Finn Christine
Current Estimated Value
Home Financials for this Owner
Home Financials are based on the most recent Mortgage that was taken out on this home.
Original Mortgage
$178,000
Outstanding Balance
$136,748
Interest Rate
4%
Mortgage Type
Adjustable Rate Mortgage/ARM
Estimated Equity
$537,427
Purchase Details
Closed on
Aug 21, 2003
Sold by
Morrissey Molly M
Bought by
Fine Carl S
Home Financials for this Owner
Home Financials are based on the most recent Mortgage that was taken out on this home.
Original Mortgage
$217,500
Interest Rate
5.52%
Mortgage Type
Purchase Money Mortgage
Purchase Details
Closed on
Dec 3, 1997
Sold by
Panzetta Rose and Cowley Phyllis R
Bought by
Carpentier Janet M
Home Financials for this Owner
Home Financials are based on the most recent Mortgage that was taken out on this home.
Original Mortgage
$107,250
Interest Rate
7.28%
Mortgage Type
Purchase Money Mortgage
Create a Home Valuation Report for This Property
The Home Valuation Report is an in-depth analysis detailing your home's value as well as a comparison with similar homes in the area
Home Values in the Area
Average Home Value in this Area
Purchase History
| Date | Buyer | Sale Price | Title Company |
|---|---|---|---|
| Finn Carl S | -- | -- | |
| Fine Carl S | $286,000 | -- | |
| Carpentier Janet M | $115,000 | -- |
Source: Public Records
Mortgage History
| Date | Status | Borrower | Loan Amount |
|---|---|---|---|
| Open | Finn Carl S | $178,000 | |
| Previous Owner | Fine Carl S | $217,500 | |
| Previous Owner | Carpentier Janet M | $107,250 |
Source: Public Records
Tax History Compared to Growth
Tax History
| Year | Tax Paid | Tax Assessment Tax Assessment Total Assessment is a certain percentage of the fair market value that is determined by local assessors to be the total taxable value of land and additions on the property. | Land | Improvement |
|---|---|---|---|---|
| 2025 | $6,350 | $548,400 | $207,500 | $340,900 |
| 2024 | $5,633 | $516,800 | $235,500 | $281,300 |
| 2023 | $5,550 | $516,800 | $235,500 | $281,300 |
| 2022 | $5,113 | $469,900 | $214,100 | $255,800 |
| 2021 | $4,645 | $435,300 | $203,900 | $231,400 |
| 2020 | $4,370 | $413,800 | $172,400 | $241,400 |
| 2019 | $4,114 | $390,300 | $142,300 | $248,000 |
| 2018 | $3,786 | $361,300 | $142,300 | $219,000 |
| 2017 | $3,787 | $357,600 | $142,300 | $215,300 |
| 2016 | $3,511 | $319,200 | $140,600 | $178,600 |
| 2015 | $3,517 | $290,400 | $140,100 | $150,300 |
| 2014 | $3,414 | $271,400 | $140,100 | $131,300 |
Source: Public Records
Map
Nearby Homes
- 25R Rockland St Unit 6
- 5245 Washington St Unit 5
- 235 Curve St
- 57 Rockland St
- 94 Rockland St
- 70 Birchwood St
- 199 Glenellen Rd
- 191 Glenellen Rd
- 11 Cheriton Rd Unit 102B
- 110 New Haven St
- 150 Grove St
- 83 Mount Hope St
- 55 Cottage Rd
- 115 Grove St Unit 11
- 111 Grove St Unit 6
- 8 Fort Ln
- 42 Churchill Place
- 2 Cocci Way
- 321 East St
- 45 Weymouth Ave