Estimated Value: $609,043 - $725,000
5
Beds
4
Baths
2,182
Sq Ft
$306/Sq Ft
Est. Value
About This Home
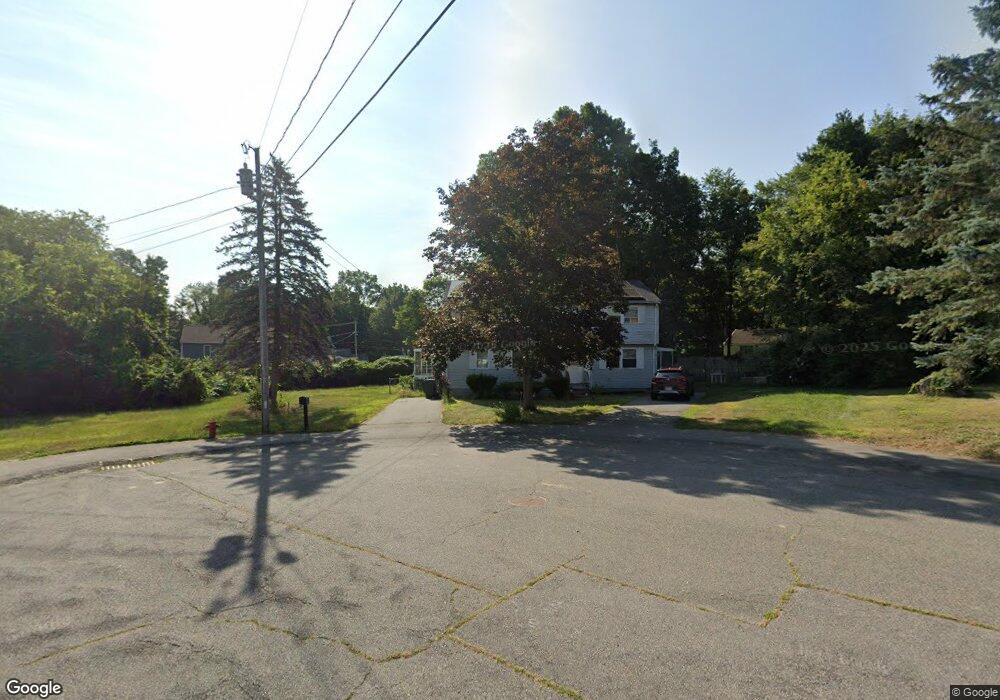
This home is located at 18 Bows Ln Unit 20, Avon, MA 02322 and is currently estimated at $667,511, approximately $305 per square foot. 18 Bows Ln Unit 20 is a home located in Norfolk County with nearby schools including Ralph D. Butler Elementary School and Avon Middle/High School.
Ownership History
Date
Name
Owned For
Owner Type
Purchase Details
Closed on
Feb 5, 2013
Sold by
Currie Paul S and Currie Kathleen V
Bought by
Brookville Ventures Ll
Current Estimated Value
Purchase Details
Closed on
Dec 8, 2010
Sold by
Skerry David R and Paine Joy
Bought by
Currie Paul S and Currie Kathleen
Home Financials for this Owner
Home Financials are based on the most recent Mortgage that was taken out on this home.
Original Mortgage
$187,500
Interest Rate
4.24%
Mortgage Type
Purchase Money Mortgage
Purchase Details
Closed on
Sep 15, 2006
Sold by
Skerry Brian B and Skerry David R
Bought by
Skerry David R and Paine Joy
Create a Home Valuation Report for This Property
The Home Valuation Report is an in-depth analysis detailing your home's value as well as a comparison with similar homes in the area
Home Values in the Area
Average Home Value in this Area
Purchase History
We collect this data history from publicly available records. To have your information removed, we recommend requesting removal directly through your county’s website.
| Date | Buyer | Sale Price | Title Company |
|---|---|---|---|
| Brookville Ventures Ll | -- | -- | |
| Currie Paul S | $250,000 | -- | |
| Skerry David R | -- | -- |
Source: Public Records
Mortgage History
We collect this data history from publicly available records. To have your information removed, we recommend requesting removal directly through your county’s website.
| Date | Status | Borrower | Loan Amount |
|---|---|---|---|
| Previous Owner | Currie Paul S | $187,500 |
Source: Public Records
Tax History
| Year | Tax Paid | Tax Assessment Tax Assessment Total Assessment is a certain percentage of the fair market value that is determined by local assessors to be the total taxable value of land and additions on the property. | Land | Improvement |
|---|---|---|---|---|
| 2025 | $71 | $533,300 | $196,600 | $336,700 |
| 2024 | $6,455 | $460,100 | $186,300 | $273,800 |
| 2023 | $6,267 | $460,100 | $186,300 | $273,800 |
| 2022 | $6,368 | $402,800 | $155,400 | $247,400 |
| 2021 | $5,219 | $311,000 | $141,000 | $170,000 |
| 2020 | $5,483 | $309,800 | $138,100 | $171,700 |
| 2019 | $5,660 | $314,600 | $138,100 | $176,500 |
| 2018 | $5,836 | $314,600 | $138,100 | $176,500 |
| 2017 | $5,436 | $314,600 | $138,100 | $176,500 |
| 2016 | $5,788 | $338,300 | $138,300 | $200,000 |
| 2015 | $5,332 | $325,700 | $125,700 | $200,000 |
Source: Public Records
Map
Nearby Homes
- 478 E Main St
- 447 E Main St
- 125 Burkeside Ave
- 71 W Spring St
- 9 Gaudette Ave
- 196 E Main St Unit C
- 191 E Spring St
- 193 E Spring St
- 192 E Spring St
- 838 N Montello St
- 178 Oak St
- 150 E High St
- 358 Battles St
- 118 Oak Ln Unit 10
- 508 Oak St Unit 7
- 14 Leonard Ln
- 0 Vine St
- 30 Intervale St
- 19 Atlanta St
- 72 Kurland Ave
Your Personal Tour Guide
Ask me questions while you tour the home.