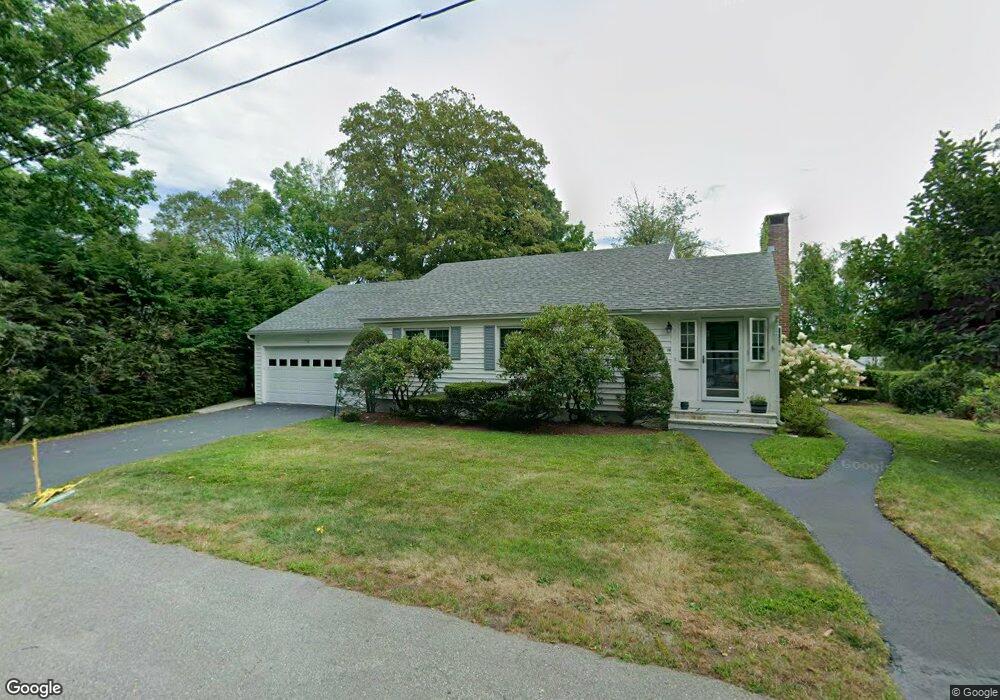
18 Bradley Ct Jaffrey, NH 03452
Estimated Value: $352,000 - $405,000
2
Beds
4
Baths
1,660
Sq Ft
$225/Sq Ft
Est. Value
About This Home
This home is located at 18 Bradley Ct, Jaffrey, NH 03452 and is currently estimated at $373,823, approximately $225 per square foot. 18 Bradley Ct is a home located in Cheshire County with nearby schools including Jaffrey Grade School, Conant Middle High School, and Conant High School.
Ownership History
Date
Name
Owned For
Owner Type
Purchase Details
Closed on
Sep 19, 2024
Sold by
Tieger Marc P and Tieger Sharon D
Bought by
Haavy Homes Llc
Current Estimated Value
Purchase Details
Closed on
Mar 28, 2018
Sold by
Tieger Marc P and Tieger Sharon D
Bought by
Tieger Marc P and Tieger Sharon D
Purchase Details
Closed on
Mar 28, 2000
Sold by
Homer J Belletete Revo
Bought by
Tieger Marc P and Tieger Judith L
Home Financials for this Owner
Home Financials are based on the most recent Mortgage that was taken out on this home.
Original Mortgage
$77,000
Interest Rate
8.31%
Create a Home Valuation Report for This Property
The Home Valuation Report is an in-depth analysis detailing your home's value as well as a comparison with similar homes in the area
Home Values in the Area
Average Home Value in this Area
Purchase History
| Date | Buyer | Sale Price | Title Company |
|---|---|---|---|
| Haavy Homes Llc | $79,533 | None Available | |
| Tieger Marc P | -- | -- | |
| Tieger Marc P | -- | -- | |
| Tieger Marc P | $96,500 | -- | |
| Tieger Marc P | $96,500 | -- |
Source: Public Records
Mortgage History
| Date | Status | Borrower | Loan Amount |
|---|---|---|---|
| Previous Owner | Tieger Marc P | $120,000 | |
| Previous Owner | Tieger Marc P | $123,000 | |
| Previous Owner | Tieger Marc P | $67,000 | |
| Previous Owner | Tieger Marc P | $77,000 |
Source: Public Records
Tax History Compared to Growth
Tax History
| Year | Tax Paid | Tax Assessment Tax Assessment Total Assessment is a certain percentage of the fair market value that is determined by local assessors to be the total taxable value of land and additions on the property. | Land | Improvement |
|---|---|---|---|---|
| 2024 | $6,773 | $206,500 | $39,900 | $166,600 |
| 2023 | $6,887 | $206,500 | $39,900 | $166,600 |
| 2022 | $6,397 | $206,500 | $39,900 | $166,600 |
| 2021 | $5,754 | $206,300 | $39,900 | $166,400 |
| 2020 | $5,679 | $206,300 | $39,900 | $166,400 |
| 2019 | $5,521 | $158,500 | $31,900 | $126,600 |
| 2018 | $5,231 | $158,500 | $31,900 | $126,600 |
| 2017 | $5,226 | $158,500 | $31,900 | $126,600 |
| 2016 | $5,264 | $159,500 | $31,900 | $127,600 |
| 2015 | $5,299 | $159,500 | $31,900 | $127,600 |
| 2014 | $5,822 | $197,678 | $54,242 | $143,436 |
| 2013 | $5,752 | $197,678 | $54,242 | $143,436 |
Source: Public Records
Map
Nearby Homes
- 8 Cross St
- 40 Charlonne St
- 75 Main St
- 11 Saint Jean St
- 14 Windy Fields Ln
- 94 Fitch Rd
- 33 Summit Dr
- 122 Proctor Rd
- 219 Gilmore Pond Rd
- 64 Summit Dr
- 29 Andrews Dr
- 13 Harkness Rd
- 121 Overview Dr
- 98 Perry Rd
- 199 Bryant Rd
- 18 Roberts Dr Unit 1
- 65 Roberts Dr Unit 17
- 57 Roberts Dr Unit 19
- 520 North St
- 52 Roberts Dr Unit 5