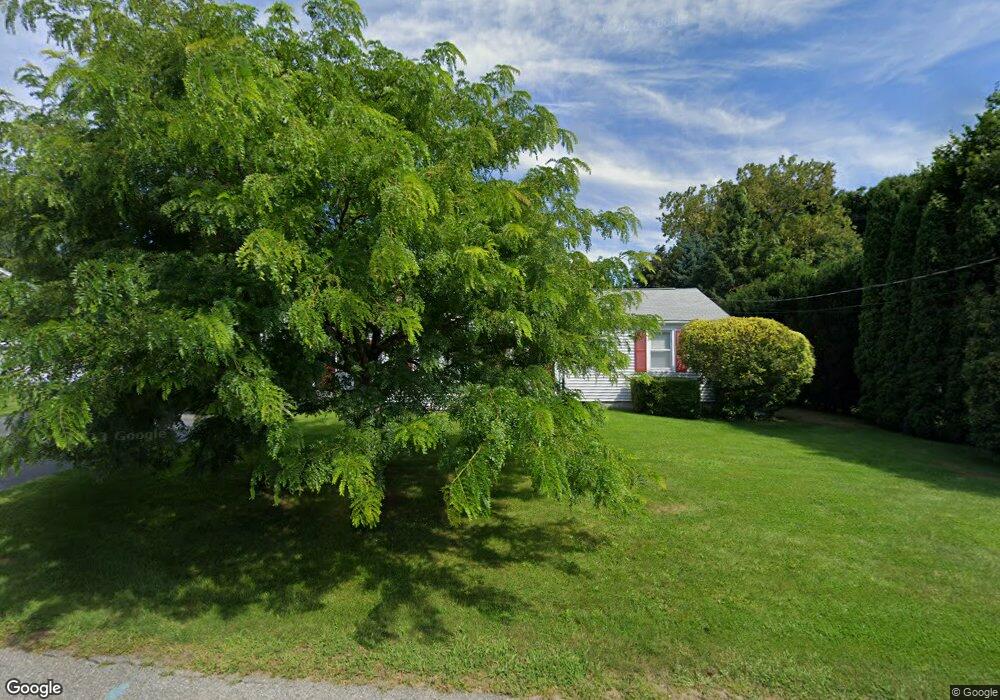
18 Brandywine Rd West Boylston, MA 01583
Estimated Value: $443,000 - $460,000
2
Beds
1
Bath
1,032
Sq Ft
$440/Sq Ft
Est. Value
About This Home
This home is located at 18 Brandywine Rd, West Boylston, MA 01583 and is currently estimated at $453,758, approximately $439 per square foot. 18 Brandywine Rd is a home located in Worcester County with nearby schools including Major Edwards Elementary School, West Boylston Junior/Senior High School, and Abby Kelley Foster Charter Public School.
Ownership History
Date
Name
Owned For
Owner Type
Purchase Details
Closed on
Mar 14, 2018
Sold by
Mackenzie Donald B and Mackenzie Amy
Bought by
Mackenzie Donald B
Current Estimated Value
Purchase Details
Closed on
Mar 22, 2016
Sold by
Mackenzie Donald B
Bought by
Mackenzie Donald B and Mackenzie Amy
Purchase Details
Closed on
Mar 7, 2008
Sold by
Doucimo Beverly A and Doucimo Pasquale J
Bought by
Mackenzie Donald B
Home Financials for this Owner
Home Financials are based on the most recent Mortgage that was taken out on this home.
Original Mortgage
$223,100
Interest Rate
5.57%
Mortgage Type
Purchase Money Mortgage
Purchase Details
Closed on
Apr 28, 1995
Sold by
Mentch Debra
Bought by
Doucimo Pasquale and Doucimo Beverly
Home Financials for this Owner
Home Financials are based on the most recent Mortgage that was taken out on this home.
Original Mortgage
$103,950
Interest Rate
8.33%
Mortgage Type
Purchase Money Mortgage
Create a Home Valuation Report for This Property
The Home Valuation Report is an in-depth analysis detailing your home's value as well as a comparison with similar homes in the area
Home Values in the Area
Average Home Value in this Area
Purchase History
| Date | Buyer | Sale Price | Title Company |
|---|---|---|---|
| Mackenzie Donald B | -- | -- | |
| Mackenzie Donald B | -- | -- | |
| Mackenzie Donald B | $230,000 | -- | |
| Doucimo Pasquale | $115,500 | -- |
Source: Public Records
Mortgage History
| Date | Status | Borrower | Loan Amount |
|---|---|---|---|
| Previous Owner | Mackenzie Donald B | $223,100 | |
| Previous Owner | Doucimo Pasquale | $79,700 | |
| Previous Owner | Doucimo Pasquale | $97,700 | |
| Previous Owner | Doucimo Pasquale | $103,950 | |
| Previous Owner | Doucimo Pasquale | $48,000 |
Source: Public Records
Tax History Compared to Growth
Tax History
| Year | Tax Paid | Tax Assessment Tax Assessment Total Assessment is a certain percentage of the fair market value that is determined by local assessors to be the total taxable value of land and additions on the property. | Land | Improvement |
|---|---|---|---|---|
| 2025 | $54 | $387,400 | $94,900 | $292,500 |
| 2024 | $5,291 | $358,000 | $94,900 | $263,100 |
| 2023 | $5,190 | $333,100 | $94,300 | $238,800 |
| 2022 | $4,912 | $277,800 | $94,300 | $183,500 |
| 2021 | $4,768 | $258,300 | $90,500 | $167,800 |
| 2020 | $4,678 | $251,800 | $90,500 | $161,300 |
| 2019 | $4,398 | $233,300 | $90,500 | $142,800 |
| 2018 | $4,205 | $224,600 | $90,500 | $134,100 |
| 2017 | $3,758 | $199,900 | $90,500 | $109,400 |
| 2016 | $3,668 | $198,800 | $84,300 | $114,500 |
| 2015 | $3,457 | $188,500 | $83,400 | $105,100 |
Source: Public Records
Map
Nearby Homes
- 1 Highland Ave
- 39 Davidson Rd
- 62 Maple St
- 54 Maple St
- 12 Birchbrush Ln
- 152 Worcester St Unit 8
- 740 Burncoat St Unit B
- 33 Meola Ave
- 39 Meola Ave
- 156 Hillside Village Dr
- 33 Isleboro St
- 156 Prospect St
- 29 Isleboro St
- 1110 W Boylston St Unit A
- 1097 W Boylston St
- 83 Hillside Village Dr
- 97 Hillside Village Dr
- 59 Santoro Rd
- 44 Dixfield St
- 64 Worcester St
- 22 Brandywine Rd
- 14 Brandywine Rd
- 27 Bunkerhill Pkwy
- 31 Bunkerhill Pkwy
- 19 Brandywine Rd
- 23 Bunkerhill Pkwy
- 15 Brandywine Rd
- 12 Brandywine Rd
- 23 Brandywine Rd
- 42 Bunkerhill Pkwy
- 11 Brandywine Rd
- 46 Bunkerhill Pkwy
- 38 Bunkerhill Pkwy
- 26 Bunkerhill Pkwy
- 30 Bunkerhill Pkwy
- 19 Bunkerhill Pkwy
- 10 Brandywine Rd
- 34 Bunkerhill Pkwy
- 22 Bunkerhill Pkwy
- 51 Bunkerhill Pkwy