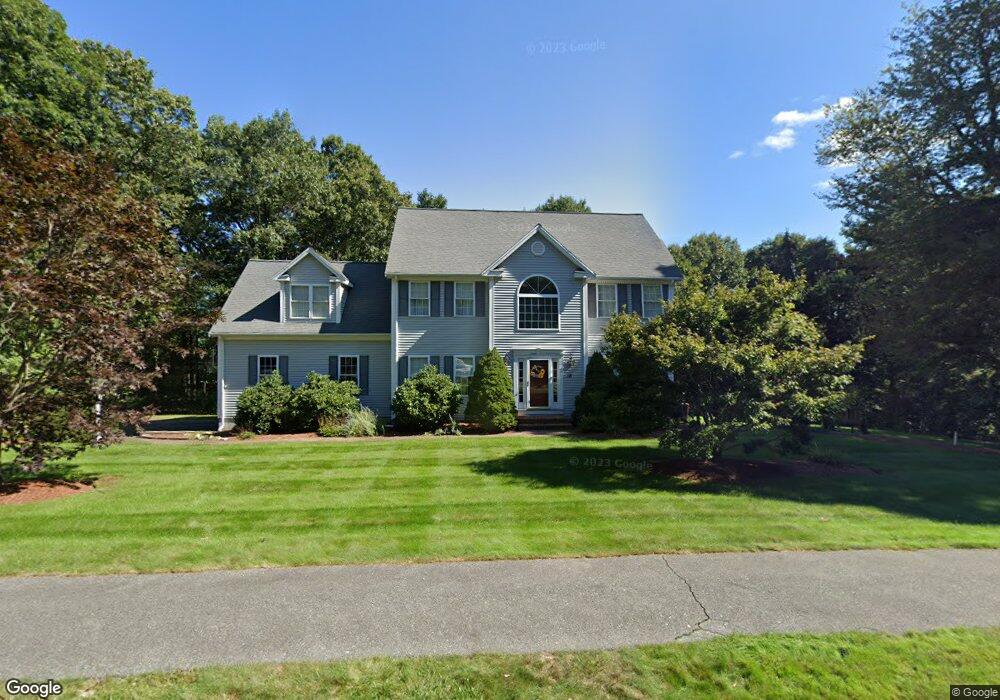
18 Broken Tree Rd Medway, MA 02053
Estimated Value: $1,006,945 - $1,187,000
4
Beds
3
Baths
2,830
Sq Ft
$389/Sq Ft
Est. Value
About This Home
This home is located at 18 Broken Tree Rd, Medway, MA 02053 and is currently estimated at $1,100,486, approximately $388 per square foot. 18 Broken Tree Rd is a home located in Norfolk County with nearby schools including John D. McGovern Elementary School, Burke-Memorial Elementary, and Medway Middle School.
Ownership History
Date
Name
Owned For
Owner Type
Purchase Details
Closed on
Jul 25, 2007
Sold by
Quantum Relocation Llc
Bought by
Mitchell Fred F and Mitchell Leslie R
Current Estimated Value
Home Financials for this Owner
Home Financials are based on the most recent Mortgage that was taken out on this home.
Original Mortgage
$417,000
Interest Rate
6.78%
Mortgage Type
Purchase Money Mortgage
Purchase Details
Closed on
Jun 10, 2005
Sold by
Wilkins Lee B and Wilkins Virginia A
Bought by
Cendant Mobilit Svcs C
Home Financials for this Owner
Home Financials are based on the most recent Mortgage that was taken out on this home.
Original Mortgage
$76,400
Interest Rate
5.79%
Mortgage Type
Purchase Money Mortgage
Purchase Details
Closed on
Jan 21, 2000
Sold by
Hamblin John L and Hamblin Rosanne
Bought by
Wilkins Lee B and Wilkins Virginia A
Purchase Details
Closed on
Feb 18, 1998
Sold by
Pine Tree Rt
Bought by
Alexander Capital Dev
Create a Home Valuation Report for This Property
The Home Valuation Report is an in-depth analysis detailing your home's value as well as a comparison with similar homes in the area
Home Values in the Area
Average Home Value in this Area
Purchase History
| Date | Buyer | Sale Price | Title Company |
|---|---|---|---|
| Mitchell Fred F | $624,000 | -- | |
| Quantum Relocation Llc | $624,000 | -- | |
| Cendant Mobilit Svcs C | $654,900 | -- | |
| Cendant Mobilit Svcs C | $654,900 | -- | |
| Alexander Capital Dev | $88,000 | -- | |
| Quantum Relocation Llc | $624,000 | -- | |
| Touhey Megan J | $654,900 | -- | |
| Wilkins Lee B | $389,800 | -- | |
| Alexander Capital Dev | $88,000 | -- |
Source: Public Records
Mortgage History
| Date | Status | Borrower | Loan Amount |
|---|---|---|---|
| Open | Alexander Capital Dev | $414,000 | |
| Closed | Quantum Relocation Llc | $417,000 | |
| Closed | Alexander Capital Dev | $0 | |
| Previous Owner | Cendant Mobilit Svcs C | $76,400 |
Source: Public Records
Tax History
| Year | Tax Paid | Tax Assessment Tax Assessment Total Assessment is a certain percentage of the fair market value that is determined by local assessors to be the total taxable value of land and additions on the property. | Land | Improvement |
|---|---|---|---|---|
| 2025 | $12,526 | $879,000 | $339,900 | $539,100 |
| 2024 | $12,658 | $879,000 | $339,900 | $539,100 |
| 2023 | $12,067 | $757,000 | $309,400 | $447,600 |
| 2022 | $11,010 | $650,300 | $228,800 | $421,500 |
| 2021 | $11,042 | $632,400 | $213,500 | $418,900 |
| 2020 | $10,903 | $623,000 | $213,500 | $409,500 |
| 2019 | $10,369 | $611,000 | $204,800 | $406,200 |
| 2018 | $10,672 | $604,300 | $204,800 | $399,500 |
| 2017 | $10,186 | $568,400 | $196,100 | $372,300 |
| 2016 | $9,691 | $535,100 | $185,200 | $349,900 |
| 2015 | $9,653 | $529,200 | $185,200 | $344,000 |
| 2014 | $10,072 | $534,600 | $215,700 | $318,900 |
Source: Public Records
Map
Nearby Homes
- 11 Fairway Ln
- 17 Fairway Ln
- 731 Norfolk St
- 33 Gorwin Dr
- 3 Jameson Dr Unit 3
- 19 Sycamore Way
- 0 Hill St
- 40 Timber Crest Dr
- 6 Glen Ellen Blvd Unit 6
- 50 Main St
- 124 Glen Ellen Blvd Unit 124
- 79 Lovering St Unit B
- 26 Timber Crest Dr
- 13 Hattie Ln Unit 13
- 66 Lakeshore Dr
- 58 Holliston St
- 261 Rolling Meadow Dr
- 50 Walnut St
- 10 April Way
- 4 Brookview Rd
- 16 Broken Tree Rd
- 11 Hickory Dr
- 13 Hickory Dr
- 20 Broken Tree Rd
- 17 Hickory Dr
- 14 Broken Tree Rd
- 17 Broken Tree Rd
- 38 Broken Tree Rd
- 19 Hickory Dr
- 9 Hickory Dr
- 7 Birch Bark Rd
- 15 Broken Tree Rd
- 19 Broken Tree Rd
- 21 Lot 21 Broken Tree
- 5 Hickory Dr
- 13 Broken Tree Rd
- 12 Hickory Dr
- 14 Hickory Dr
- 16 Hickory Dr
- 22 Broken Tree Rd
Your Personal Tour Guide
Ask me questions while you tour the home.