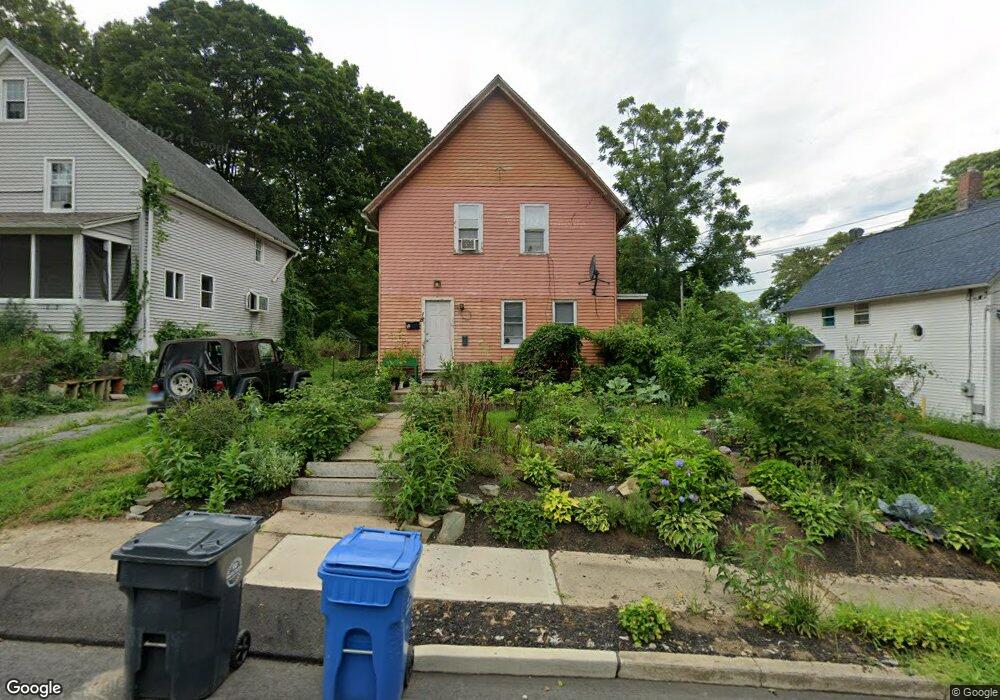
18 Buck St Danielson, CT 06239
Estimated Value: $234,000 - $301,000
5
Beds
2
Baths
2,123
Sq Ft
$126/Sq Ft
Est. Value
About This Home
This home is located at 18 Buck St, Danielson, CT 06239 and is currently estimated at $267,732, approximately $126 per square foot. 18 Buck St is a home located in Windham County with nearby schools including Killingly Central School, Killingly Memorial School, and Killingly Intermediate School.
Ownership History
Date
Name
Owned For
Owner Type
Purchase Details
Closed on
Aug 13, 2010
Sold by
Shields Jacob C
Bought by
Us Bk
Current Estimated Value
Purchase Details
Closed on
Aug 18, 2004
Sold by
Pier Properties Inc
Bought by
Shields Jacob C
Purchase Details
Closed on
Aug 6, 1997
Sold by
Sargent M Freeman
Bought by
Bonet Luis A
Purchase Details
Closed on
Jul 29, 1994
Sold by
Ne Capitol Funding
Bought by
Sargent M Freeman
Purchase Details
Closed on
Mar 1, 1993
Sold by
Gap Prtnrs Inc
Bought by
Cooper Elma
Create a Home Valuation Report for This Property
The Home Valuation Report is an in-depth analysis detailing your home's value as well as a comparison with similar homes in the area
Home Values in the Area
Average Home Value in this Area
Purchase History
| Date | Buyer | Sale Price | Title Company |
|---|---|---|---|
| Us Bk | -- | -- | |
| Us Bk | -- | -- | |
| Shields Jacob C | $135,000 | -- | |
| Shields Jacob C | $135,000 | -- | |
| Bonet Luis A | $70,000 | -- | |
| Bonet Luis A | $70,000 | -- | |
| Sargent M Freeman | $71,400 | -- | |
| Sargent M Freeman | $71,400 | -- | |
| Cooper Elma | $79,900 | -- | |
| Cooper Elma V | $79,900 | -- |
Source: Public Records
Mortgage History
| Date | Status | Borrower | Loan Amount |
|---|---|---|---|
| Previous Owner | Cooper Elma V | $163,500 |
Source: Public Records
Tax History
| Year | Tax Paid | Tax Assessment Tax Assessment Total Assessment is a certain percentage of the fair market value that is determined by local assessors to be the total taxable value of land and additions on the property. | Land | Improvement |
|---|---|---|---|---|
| 2025 | $3,175 | $126,750 | $21,020 | $105,730 |
| 2024 | $3,031 | $126,750 | $21,020 | $105,730 |
| 2023 | $1,707 | $53,200 | $6,510 | $46,690 |
| 2022 | $1,606 | $53,200 | $6,510 | $46,690 |
| 2021 | $1,606 | $53,200 | $6,510 | $46,690 |
| 2020 | $1,580 | $53,200 | $6,510 | $46,690 |
| 2019 | $1,597 | $53,200 | $6,510 | $46,690 |
| 2017 | $1,400 | $43,400 | $6,510 | $36,890 |
| 2016 | $1,400 | $43,400 | $6,510 | $36,890 |
| 2015 | $1,372 | $43,400 | $6,510 | $36,890 |
| 2014 | $1,339 | $43,400 | $6,510 | $36,890 |
Source: Public Records
Map
Nearby Homes
Your Personal Tour Guide
Ask me questions while you tour the home.