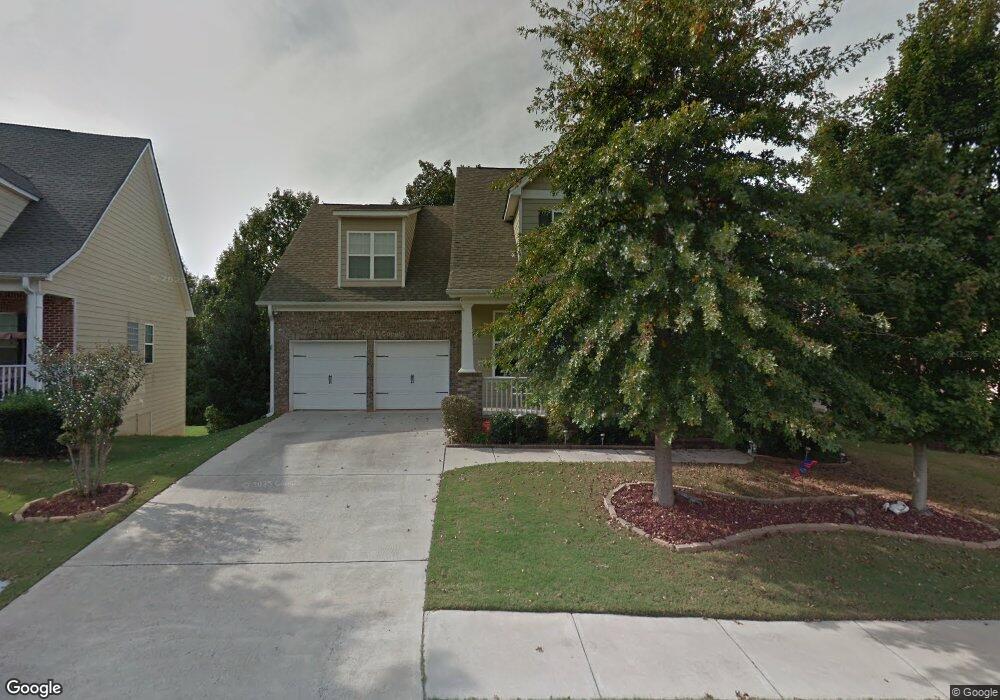
18 Camden Cir Newnan, GA 30265
Estimated Value: $424,000 - $456,000
4
Beds
3
Baths
3,638
Sq Ft
$120/Sq Ft
Est. Value
About This Home
This home is located at 18 Camden Cir, Newnan, GA 30265 and is currently estimated at $435,671, approximately $119 per square foot. 18 Camden Cir is a home located in Coweta County with nearby schools including Newnan Crossing Elementary School, Lee Middle School, and East Coweta High School.
Ownership History
Date
Name
Owned For
Owner Type
Purchase Details
Closed on
Dec 28, 2018
Sold by
Restituto William A
Bought by
Hentz Tucker Jared L and Hentz Tucker Abby
Current Estimated Value
Purchase Details
Closed on
Apr 29, 2005
Sold by
Heartland Development Inc
Bought by
Garner Homes Llc
Purchase Details
Closed on
Nov 11, 2004
Sold by
Prestigious Homes Inc
Bought by
Heartland Development Inc
Purchase Details
Closed on
Sep 2, 2004
Sold by
Heartland Development Inc
Bought by
Prestigious Homes Inc
Purchase Details
Closed on
Sep 29, 2003
Sold by
Lower Fayetteville Ventures Inc
Bought by
Heartland Development Inc
Create a Home Valuation Report for This Property
The Home Valuation Report is an in-depth analysis detailing your home's value as well as a comparison with similar homes in the area
Home Values in the Area
Average Home Value in this Area
Purchase History
| Date | Buyer | Sale Price | Title Company |
|---|---|---|---|
| Hentz Tucker Jared L | $290,000 | -- | |
| Garner Homes Llc | $124,500 | -- | |
| Heartland Development Inc | $2,800 | -- | |
| Prestigious Homes Inc | $256,000 | -- | |
| Heartland Development Inc | $872,000 | -- |
Source: Public Records
Tax History Compared to Growth
Tax History
| Year | Tax Paid | Tax Assessment Tax Assessment Total Assessment is a certain percentage of the fair market value that is determined by local assessors to be the total taxable value of land and additions on the property. | Land | Improvement |
|---|---|---|---|---|
| 2025 | $4,142 | $172,464 | $30,000 | $142,464 |
| 2024 | $4,192 | $183,456 | $30,000 | $153,456 |
| 2023 | $4,192 | $180,697 | $22,000 | $158,697 |
| 2022 | $3,679 | $151,222 | $22,000 | $129,222 |
| 2021 | $3,619 | $134,654 | $16,000 | $118,654 |
| 2020 | $3,701 | $134,654 | $16,000 | $118,654 |
| 2019 | $3,485 | $119,286 | $12,000 | $107,286 |
| 2018 | $3,605 | $119,286 | $12,000 | $107,286 |
| 2017 | $3,476 | $115,528 | $10,000 | $105,528 |
| 2016 | $3,479 | $115,528 | $10,000 | $105,528 |
| 2015 | $2,954 | $97,940 | $10,000 | $87,940 |
| 2014 | $2,974 | $95,302 | $10,000 | $85,302 |
Source: Public Records
Map
Nearby Homes
- 30 Camden Cir
- 92 Camden Village Dr
- 88 Camden Village Dr
- 195 Southwind Ln
- 234 Southwind Ln
- 202 Southwind Cir
- 502 Hunterian Place
- 322 Westhill Dr
- 65 Tapestry Ln
- 91 Medallion Park
- 11 Keystone Cir
- 14 Tillbrook Trail
- 102 Harrison Park
- 14 Cobalt Ln Unit 68
- 27 Cobalt Ln Unit 77
- 23 Cobalt Ln Unit 75
- 29 Cobalt Ln Unit 78
- 35 Cobalt Ln
- 35 Cobalt Ln Unit 81
- 51 Burke Rd
- 18 Camden Cir Unit 117
- 22 Camden Cir
- 14 Camden Cir
- 26 Camden Cir
- 10 Camden Cir
- 10 Camden Cir Unit 10
- 10 Camden Cir
- 15 Camden Cir
- 13 Camden Cir
- 13 Camden Cir Unit 85
- 13 Camden Cir Unit 86
- 19 Camden Cir
- 11 Camden Cir Unit 86
- 11 Camden Cir
- 6 Camden Cir
- 6 Camden Cir Unit 60
- 7 Camden Cir Unit B87
- 7 Camden Cir
- 116 Camden Rd
- 116 Camden Rd Unit 93