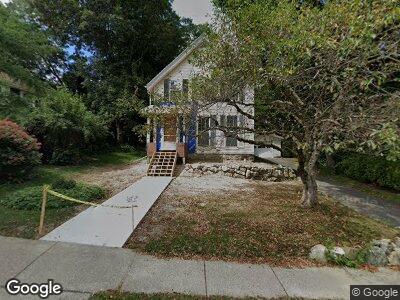
18 Charles St Melrose, MA 02176
Cedar Park NeighborhoodEstimated Value: $1,068,179 - $1,256,000
3
Beds
3
Baths
2,264
Sq Ft
$500/Sq Ft
Est. Value
About This Home
This home is located at 18 Charles St, Melrose, MA 02176 and is currently estimated at $1,131,795, approximately $499 per square foot. 18 Charles St is a home located in Middlesex County with nearby schools including Roosevelt Elementary School, Lincoln Elementary School, and Horace Mann Elementary School.
Ownership History
Date
Name
Owned For
Owner Type
Purchase Details
Closed on
Aug 22, 2019
Sold by
Nordberg Joel E and Nordberg Joan E
Bought by
Nordberg Ft
Current Estimated Value
Purchase Details
Closed on
Feb 16, 2018
Sold by
Starr Matthew S and Birch Alison B
Bought by
Nordberg Joel E and Nordberg Joan E
Purchase Details
Closed on
Dec 10, 1986
Bought by
Nordberg Joel E and Nordberg Joan E
Create a Home Valuation Report for This Property
The Home Valuation Report is an in-depth analysis detailing your home's value as well as a comparison with similar homes in the area
Home Values in the Area
Average Home Value in this Area
Purchase History
| Date | Buyer | Sale Price | Title Company |
|---|---|---|---|
| Nordberg Ft | -- | -- | |
| Nordberg Joel E | $4,000 | -- | |
| Nordberg Joel E | $179,500 | -- |
Source: Public Records
Mortgage History
| Date | Status | Borrower | Loan Amount |
|---|---|---|---|
| Previous Owner | Nordberg Joel E | $120,600 |
Source: Public Records
Tax History Compared to Growth
Tax History
| Year | Tax Paid | Tax Assessment Tax Assessment Total Assessment is a certain percentage of the fair market value that is determined by local assessors to be the total taxable value of land and additions on the property. | Land | Improvement |
|---|---|---|---|---|
| 2025 | $87 | $878,700 | $480,200 | $398,500 |
| 2024 | $8,302 | $836,100 | $451,100 | $385,000 |
| 2023 | $8,305 | $797,000 | $436,600 | $360,400 |
| 2022 | $8,290 | $784,300 | $436,600 | $347,700 |
| 2021 | $7,983 | $729,000 | $407,500 | $321,500 |
| 2020 | $7,574 | $685,400 | $363,800 | $321,600 |
| 2019 | $6,044 | $559,100 | $336,200 | $222,900 |
| 2018 | $5,696 | $502,700 | $304,000 | $198,700 |
| 2017 | $5,545 | $469,900 | $289,500 | $180,400 |
| 2016 | $5,466 | $443,300 | $282,200 | $161,100 |
| 2015 | $5,262 | $406,000 | $253,300 | $152,700 |
| 2014 | $5,008 | $377,100 | $224,400 | $152,700 |
Source: Public Records
Map
Nearby Homes
- 63 Lynn Fells Pkwy
- 16 Wentworth Rd
- 40 Holland Rd
- 31 Poplar St
- 24 Otis St
- 40-42 Tappan St
- 45 Vinton St
- 80 Baxter St
- 40 Upland Rd
- 43 Warwick Rd
- 115 W Emerson St Unit 102
- 41 Harrison St
- 54 Brunswick Park
- 148 Myrtle St Unit 1
- 63 W Emerson St Unit 4
- 126 W Wyoming Ave
- 38-40 Hurd St
- 27 Winthrop St Unit 27
- 36 W Emerson St
- 42 North Ave
- 18 Charles St
- 22 Charles St
- 12 Charles St
- 287 W Emerson St
- 11 Holland Rd
- 293 W Emerson St
- 82 Oakland St
- 26 Charles St
- 277 W Emerson St Unit 2
- 277 W Emerson St
- 81 Oakland St
- 5 Holland Rd
- 30 Charles St
- 17 Holland Rd
- 74 Oakland St
- 74 Oakland St
- 74 Oakland St Unit 2
- 74 Oakland St Unit 1
- 75 Oakland St
- 267 W Emerson St