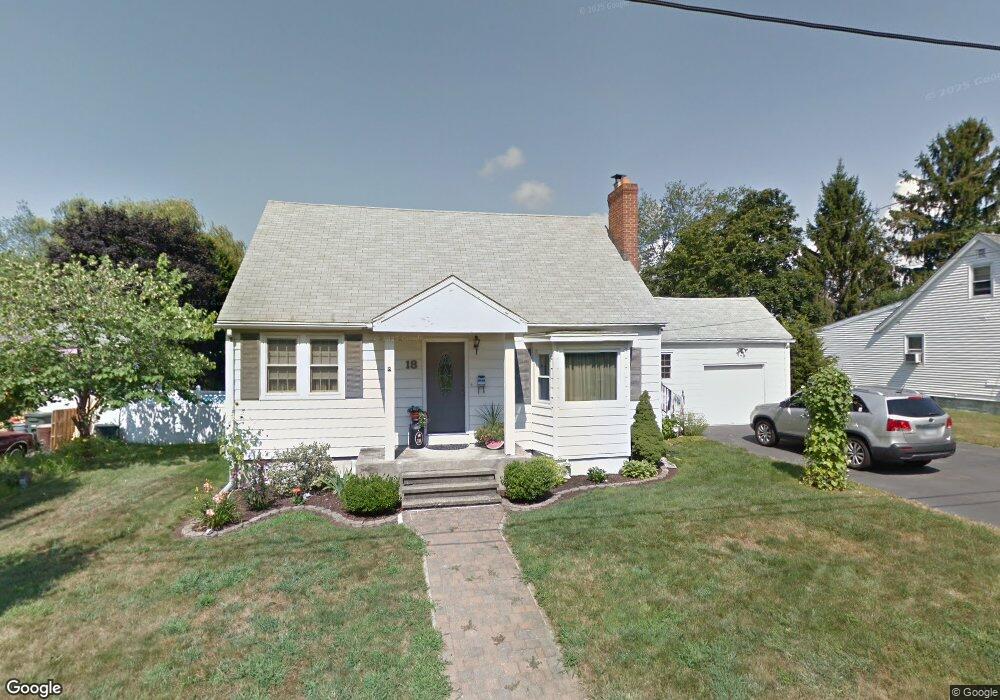
18 Chaucer Ct Milford, CT 06460
Woodmont NeighborhoodEstimated Value: $508,127 - $591,000
3
Beds
2
Baths
1,530
Sq Ft
$351/Sq Ft
Est. Value
About This Home
This home is located at 18 Chaucer Ct, Milford, CT 06460 and is currently estimated at $537,032, approximately $351 per square foot. 18 Chaucer Ct is a home located in New Haven County with nearby schools including Live Oaks School, East Shore Middle School, and Joseph A. Foran High School.
Ownership History
Date
Name
Owned For
Owner Type
Purchase Details
Closed on
Jul 1, 2004
Sold by
Smith James M and Smith Lisa M
Bought by
Maciseo Thomas P and Maciseo Susan E
Current Estimated Value
Purchase Details
Closed on
Dec 20, 2000
Sold by
Quesinberry Kimberly
Bought by
Smith James M and Smith Lisa M
Purchase Details
Closed on
Feb 26, 1993
Sold by
Palmer Jonathan and Palmer Sheila C A
Bought by
Quesinberry Kimberly
Create a Home Valuation Report for This Property
The Home Valuation Report is an in-depth analysis detailing your home's value as well as a comparison with similar homes in the area
Home Values in the Area
Average Home Value in this Area
Purchase History
| Date | Buyer | Sale Price | Title Company |
|---|---|---|---|
| Maciseo Thomas P | $278,000 | -- | |
| Maciseo Thomas P | $278,000 | -- | |
| Smith James M | $169,000 | -- | |
| Smith James M | $169,000 | -- | |
| Quesinberry Kimberly | $158,000 | -- | |
| Quesinberry Kimberly | $158,000 | -- |
Source: Public Records
Mortgage History
| Date | Status | Borrower | Loan Amount |
|---|---|---|---|
| Open | Quesinberry Kimberly | $50,000 | |
| Open | Quesinberry Kimberly | $144,000 |
Source: Public Records
Tax History Compared to Growth
Tax History
| Year | Tax Paid | Tax Assessment Tax Assessment Total Assessment is a certain percentage of the fair market value that is determined by local assessors to be the total taxable value of land and additions on the property. | Land | Improvement |
|---|---|---|---|---|
| 2025 | $6,937 | $234,760 | $97,370 | $137,390 |
| 2024 | $6,841 | $234,760 | $97,370 | $137,390 |
| 2023 | $6,378 | $234,760 | $97,370 | $137,390 |
| 2022 | $6,256 | $234,760 | $97,370 | $137,390 |
| 2021 | $5,463 | $197,590 | $68,290 | $129,300 |
| 2020 | $5,469 | $197,590 | $68,290 | $129,300 |
| 2019 | $5,475 | $197,590 | $68,290 | $129,300 |
| 2018 | $5,481 | $197,590 | $68,290 | $129,300 |
| 2017 | $5,491 | $197,590 | $68,290 | $129,300 |
| 2016 | $5,607 | $201,390 | $68,290 | $133,100 |
| 2015 | $5,615 | $201,390 | $68,290 | $133,100 |
| 2014 | $5,482 | $201,390 | $68,290 | $133,100 |
Source: Public Records
Map
Nearby Homes