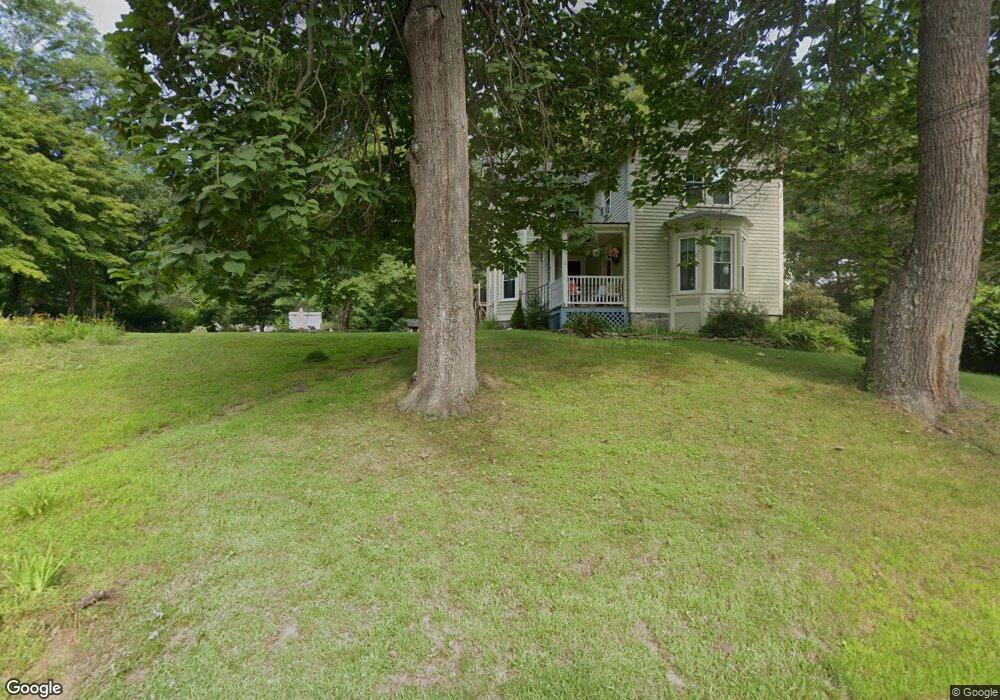
18 Collins Rd Unit 20 Collinsville, CT 06019
Estimated Value: $369,150 - $412,000
3
Beds
2
Baths
1,652
Sq Ft
$235/Sq Ft
Est. Value
About This Home
This home is located at 18 Collins Rd Unit 20, Collinsville, CT 06019 and is currently estimated at $387,538, approximately $234 per square foot. 18 Collins Rd Unit 20 is a home located in Hartford County with nearby schools including Cherry Brook Primary School, Canton Intermediate School, and Canton Middle School.
Ownership History
Date
Name
Owned For
Owner Type
Purchase Details
Closed on
Sep 22, 2015
Sold by
Staszak B Scott and Mckinney Robin L
Bought by
Erisoty Gregory J and Erisoty James P
Current Estimated Value
Home Financials for this Owner
Home Financials are based on the most recent Mortgage that was taken out on this home.
Original Mortgage
$156,000
Interest Rate
3.94%
Purchase Details
Closed on
Oct 25, 2011
Sold by
Staszak B Scott
Bought by
Mckinney Robin L
Home Financials for this Owner
Home Financials are based on the most recent Mortgage that was taken out on this home.
Original Mortgage
$120,000
Interest Rate
4.15%
Mortgage Type
Purchase Money Mortgage
Purchase Details
Closed on
Jun 28, 1998
Sold by
Warner Johnathan and Warner Susan
Bought by
Staszak B Scott
Purchase Details
Closed on
Nov 1, 1991
Sold by
Beaudoin Leo Est
Bought by
Swift Susan
Create a Home Valuation Report for This Property
The Home Valuation Report is an in-depth analysis detailing your home's value as well as a comparison with similar homes in the area
Home Values in the Area
Average Home Value in this Area
Purchase History
| Date | Buyer | Sale Price | Title Company |
|---|---|---|---|
| Erisoty Gregory J | $200,000 | -- | |
| Erisoty Gregory J | $200,000 | -- | |
| Mckinney Robin L | -- | -- | |
| Staszak B Scott | $150,000 | -- | |
| Erisoty Gregory J | $200,000 | -- | |
| Mckinney Robin L | -- | -- | |
| Staszak B Scott | $150,000 | -- | |
| Swift Susan | $131,000 | -- |
Source: Public Records
Mortgage History
| Date | Status | Borrower | Loan Amount |
|---|---|---|---|
| Closed | Erisoty Gregory J | $156,000 | |
| Previous Owner | Swift Susan | $120,000 |
Source: Public Records
Tax History Compared to Growth
Tax History
| Year | Tax Paid | Tax Assessment Tax Assessment Total Assessment is a certain percentage of the fair market value that is determined by local assessors to be the total taxable value of land and additions on the property. | Land | Improvement |
|---|---|---|---|---|
| 2025 | $6,539 | $195,190 | $64,530 | $130,660 |
| 2024 | $6,666 | $195,190 | $64,530 | $130,660 |
| 2023 | $5,091 | $143,940 | $63,250 | $80,690 |
| 2022 | $4,849 | $143,940 | $63,250 | $80,690 |
| 2021 | $4,782 | $143,940 | $63,250 | $80,690 |
| 2020 | $4,691 | $143,940 | $63,250 | $80,690 |
| 2019 | $4,610 | $143,940 | $63,250 | $80,690 |
| 2018 | $5,134 | $167,230 | $63,000 | $104,230 |
| 2017 | $5,099 | $167,230 | $63,000 | $104,230 |
| 2016 | $4,977 | $167,230 | $63,000 | $104,230 |
| 2015 | $4,881 | $167,230 | $63,000 | $104,230 |
| 2014 | $4,987 | $174,620 | $63,000 | $111,620 |
Source: Public Records
Map
Nearby Homes
- 67 Torrington Ave Unit 69
- 9 Maple Ave
- 8 Town Bridge Rd
- 60 Simonds Ave
- 1 Blanchard Rd
- 25 Sheffield Ln
- 3 E Hill Rd
- 96 Dyer Ave
- 41 Verville Rd
- 9 Village Square
- 48 Weatherstone
- 58 Weatherstone
- 44 Weatherstone
- 61 Weatherstone
- 20 Found Land Way
- 50 E Hill Rd Unit 3A
- 85 Dowd Ave Unit 89
- 78 Deepwood Dr
- 28 Meadowview Ct Unit 28
- 70 E Hill Rd
- 19A Collins Rd
- 22 Collins Rd
- 17 Collins Rd
- 17A Collins Rd
- 16 Collins Rd
- 23 Collins Rd
- 24 Collins Rd
- 15 Collins Rd
- 14 Collins Rd
- 19 Collins Rd
- 95 Torrington Ave
- 97 Torrington Ave
- 93 Torrington Ave
- 94 Torrington Ave Unit 96
- 12A Collins Rd
- 12 Collins Rd
- 89 Torrington Ave
- 100 Torrington Ave
- 86 Torrington Ave Unit 92
- 81 Torrington Ave Unit 83