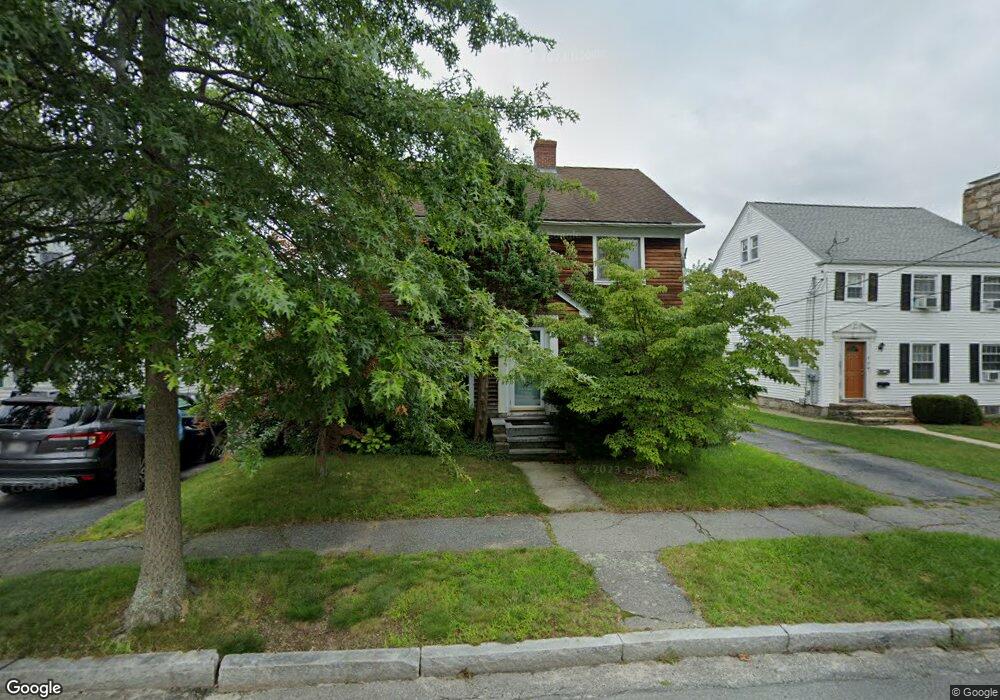
18 Collins St Worcester, MA 01606
Burncoat NeighborhoodEstimated Value: $435,583 - $488,000
3
Beds
2
Baths
1,668
Sq Ft
$283/Sq Ft
Est. Value
About This Home
This home is located at 18 Collins St, Worcester, MA 01606 and is currently estimated at $471,396, approximately $282 per square foot. 18 Collins St is a home located in Worcester County with nearby schools including Belmont Street Community School, Jacob Hiatt Magnet School, and Chandler Magnet.
Ownership History
Date
Name
Owned For
Owner Type
Purchase Details
Closed on
Oct 8, 2008
Sold by
Nugent Christine A
Bought by
Nugent Michael J
Current Estimated Value
Home Financials for this Owner
Home Financials are based on the most recent Mortgage that was taken out on this home.
Original Mortgage
$135,000
Outstanding Balance
$89,038
Interest Rate
6.43%
Mortgage Type
Purchase Money Mortgage
Estimated Equity
$382,358
Purchase Details
Closed on
Jan 14, 1992
Sold by
Dahlstrom Eric L and Dahlstrom Barbara
Bought by
Nugent Michael J and Nugent Christine
Home Financials for this Owner
Home Financials are based on the most recent Mortgage that was taken out on this home.
Original Mortgage
$62,000
Interest Rate
8.64%
Mortgage Type
Purchase Money Mortgage
Purchase Details
Closed on
Jul 6, 1987
Sold by
Dahlstrom Barbara J
Bought by
Dahlstrom Steven E
Create a Home Valuation Report for This Property
The Home Valuation Report is an in-depth analysis detailing your home's value as well as a comparison with similar homes in the area
Home Values in the Area
Average Home Value in this Area
Purchase History
| Date | Buyer | Sale Price | Title Company |
|---|---|---|---|
| Nugent Michael J | $108,000 | -- | |
| Nugent Michael J | $108,000 | -- | |
| Nugent Michael J | $69,000 | -- | |
| Nugent Michael J | $69,000 | -- | |
| Dahlstrom Steven E | $18,000 | -- |
Source: Public Records
Mortgage History
| Date | Status | Borrower | Loan Amount |
|---|---|---|---|
| Open | Nugent Michael J | $135,000 | |
| Closed | Dahlstrom Steven E | $135,000 | |
| Previous Owner | Dahlstrom Steven E | $60,000 | |
| Previous Owner | Dahlstrom Steven E | $62,000 |
Source: Public Records
Tax History
| Year | Tax Paid | Tax Assessment Tax Assessment Total Assessment is a certain percentage of the fair market value that is determined by local assessors to be the total taxable value of land and additions on the property. | Land | Improvement |
|---|---|---|---|---|
| 2025 | $5,207 | $394,800 | $105,900 | $288,900 |
| 2024 | $5,103 | $371,100 | $105,900 | $265,200 |
| 2023 | $4,911 | $342,500 | $92,100 | $250,400 |
| 2022 | $4,545 | $298,800 | $73,600 | $225,200 |
| 2021 | $4,440 | $272,700 | $58,900 | $213,800 |
| 2020 | $4,306 | $253,300 | $58,900 | $194,400 |
| 2019 | $4,154 | $230,800 | $53,000 | $177,800 |
| 2018 | $4,134 | $218,600 | $53,000 | $165,600 |
| 2017 | $3,980 | $207,100 | $53,000 | $154,100 |
| 2016 | $3,992 | $193,700 | $40,000 | $153,700 |
| 2015 | $3,888 | $193,700 | $40,000 | $153,700 |
| 2014 | $3,785 | $193,700 | $40,000 | $153,700 |
Source: Public Records
Map
Nearby Homes
- 93 Blue Bell Rd
- 4 Winston Rd
- 30 Danielles Way
- 18 Danielles Way
- 10 Beale St
- 12 Beale St
- 39 Mountainshire Dr
- 66 Eunice Ave
- 69 Santoro Rd
- 31 Danielles Way
- 55 Apthorp St
- 331 Burncoat St
- 63 Cobblestone Ln Unit 63
- 31 Enaya Cir Unit 31
- 22 Danielles Way
- 26 Danielles Way
- 323 Burncoat St
- 1110 W Boylston St Unit A
- 36 Sunrise Ave
- 33 Santoro Rd
Your Personal Tour Guide
Ask me questions while you tour the home.