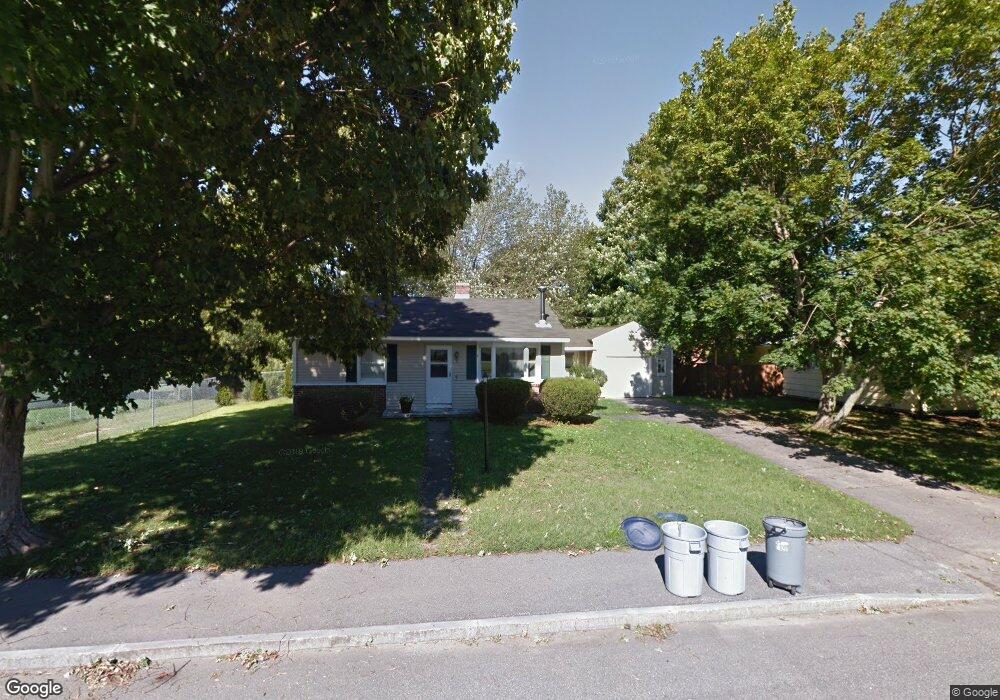
18 Conant Dr Concord, NH 03301
South End NeighborhoodEstimated Value: $414,293 - $448,000
2
Beds
1
Bath
1,146
Sq Ft
$370/Sq Ft
Est. Value
About This Home
This home is located at 18 Conant Dr, Concord, NH 03301 and is currently estimated at $424,323, approximately $370 per square foot. 18 Conant Dr is a home located in Merrimack County with nearby schools including Abbot-Downing School, Rundlett Middle School, and Concord High School.
Ownership History
Date
Name
Owned For
Owner Type
Purchase Details
Closed on
Sep 7, 2007
Sold by
Fnma
Bought by
Lightfoot Gregory and Lightfoot Ann
Current Estimated Value
Home Financials for this Owner
Home Financials are based on the most recent Mortgage that was taken out on this home.
Original Mortgage
$168,300
Interest Rate
6.74%
Mortgage Type
Purchase Money Mortgage
Purchase Details
Closed on
Mar 27, 2007
Sold by
Kelley Jeffery M and Kelley Lauren A
Bought by
Federal National Mortgage Association
Purchase Details
Closed on
Sep 23, 2004
Sold by
Messineo Joseph A and Messineo Deborah H
Bought by
Kelley Jeffrey M and Kelley Lauren A
Home Financials for this Owner
Home Financials are based on the most recent Mortgage that was taken out on this home.
Original Mortgage
$250,000
Interest Rate
5.89%
Mortgage Type
Purchase Money Mortgage
Purchase Details
Closed on
Jan 20, 1999
Sold by
Hood Revoc I Richard F
Bought by
Messineo Joseph A and Messineo Deborah H
Home Financials for this Owner
Home Financials are based on the most recent Mortgage that was taken out on this home.
Original Mortgage
$77,000
Interest Rate
6.7%
Mortgage Type
Purchase Money Mortgage
Create a Home Valuation Report for This Property
The Home Valuation Report is an in-depth analysis detailing your home's value as well as a comparison with similar homes in the area
Home Values in the Area
Average Home Value in this Area
Purchase History
| Date | Buyer | Sale Price | Title Company |
|---|---|---|---|
| Lightfoot Gregory | $93,500 | -- | |
| Federal National Mortgage Association | $210,400 | -- | |
| Kelley Jeffrey M | $250,000 | -- | |
| Messineo Joseph A | $110,000 | -- |
Source: Public Records
Mortgage History
| Date | Status | Borrower | Loan Amount |
|---|---|---|---|
| Open | Messineo Joseph A | $172,000 | |
| Closed | Messineo Joseph A | $168,300 | |
| Previous Owner | Messineo Joseph A | $250,000 | |
| Previous Owner | Messineo Joseph A | $77,000 |
Source: Public Records
Tax History Compared to Growth
Tax History
| Year | Tax Paid | Tax Assessment Tax Assessment Total Assessment is a certain percentage of the fair market value that is determined by local assessors to be the total taxable value of land and additions on the property. | Land | Improvement |
|---|---|---|---|---|
| 2024 | $7,413 | $267,700 | $109,700 | $158,000 |
| 2023 | $7,190 | $267,700 | $109,700 | $158,000 |
| 2022 | $6,931 | $267,700 | $109,700 | $158,000 |
| 2021 | $6,755 | $268,900 | $109,700 | $159,200 |
| 2020 | $6,278 | $234,600 | $87,600 | $147,000 |
| 2019 | $5,725 | $206,100 | $85,900 | $120,200 |
| 2018 | $5,714 | $202,700 | $85,900 | $116,800 |
| 2017 | $5,529 | $195,800 | $85,900 | $109,900 |
| 2016 | $5,216 | $188,500 | $84,300 | $104,200 |
| 2015 | $4,921 | $175,300 | $88,000 | $87,300 |
| 2014 | $4,700 | $175,300 | $88,000 | $87,300 |
| 2013 | -- | $172,900 | $88,000 | $84,900 |
| 2012 | -- | $168,000 | $88,000 | $80,000 |
Source: Public Records
Map
Nearby Homes