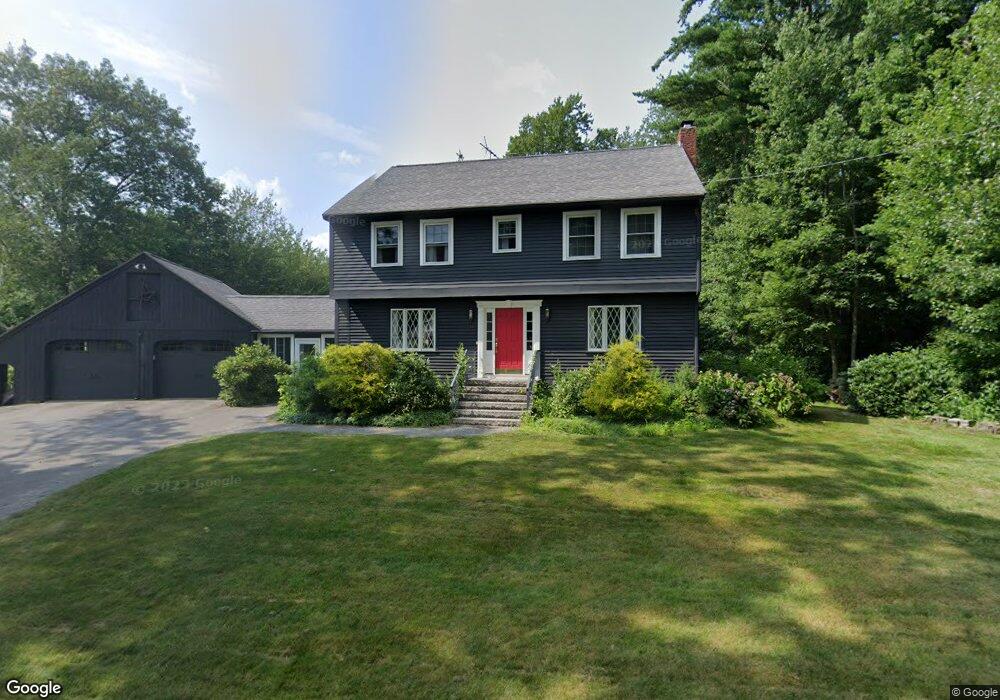
18 Connell Dr Salem, NH 03079
Depot Village NeighborhoodEstimated Value: $676,278 - $726,000
4
Beds
3
Baths
2,088
Sq Ft
$339/Sq Ft
Est. Value
About This Home
This home is located at 18 Connell Dr, Salem, NH 03079 and is currently estimated at $708,570, approximately $339 per square foot. 18 Connell Dr is a home located in Rockingham County with nearby schools including William E. Lancaster School, Woodbury School, and Salem High School.
Ownership History
Date
Name
Owned For
Owner Type
Purchase Details
Closed on
Oct 5, 2017
Sold by
Lever Gary R and Lever Virginia H
Bought by
Lever Ft
Current Estimated Value
Purchase Details
Closed on
Jul 15, 1998
Sold by
Hurd Richard R and Hurd Marylou C
Bought by
Lever Gary R and Lever Virginia H
Home Financials for this Owner
Home Financials are based on the most recent Mortgage that was taken out on this home.
Original Mortgage
$166,500
Interest Rate
6.98%
Mortgage Type
Purchase Money Mortgage
Purchase Details
Closed on
Mar 28, 1997
Sold by
Bouldin William L and Bouldin Paula
Bought by
Hurd Richard R and Hurd Marylou C
Home Financials for this Owner
Home Financials are based on the most recent Mortgage that was taken out on this home.
Original Mortgage
$162,450
Interest Rate
7.59%
Mortgage Type
Purchase Money Mortgage
Create a Home Valuation Report for This Property
The Home Valuation Report is an in-depth analysis detailing your home's value as well as a comparison with similar homes in the area
Home Values in the Area
Average Home Value in this Area
Purchase History
| Date | Buyer | Sale Price | Title Company |
|---|---|---|---|
| Lever Ft | -- | -- | |
| Lever Gary R | $186,500 | -- | |
| Hurd Richard R | $171,000 | -- |
Source: Public Records
Mortgage History
| Date | Status | Borrower | Loan Amount |
|---|---|---|---|
| Previous Owner | Hurd Richard R | $166,500 | |
| Previous Owner | Hurd Richard R | $162,450 |
Source: Public Records
Tax History Compared to Growth
Tax History
| Year | Tax Paid | Tax Assessment Tax Assessment Total Assessment is a certain percentage of the fair market value that is determined by local assessors to be the total taxable value of land and additions on the property. | Land | Improvement |
|---|---|---|---|---|
| 2024 | $8,684 | $493,400 | $190,700 | $302,700 |
| 2023 | $8,353 | $492,500 | $190,700 | $301,800 |
| 2022 | $7,905 | $492,500 | $190,700 | $301,800 |
| 2021 | $7,870 | $492,500 | $190,700 | $301,800 |
| 2020 | $7,718 | $350,500 | $136,100 | $214,400 |
| 2019 | $7,704 | $350,500 | $136,100 | $214,400 |
| 2018 | $7,574 | $350,500 | $136,100 | $214,400 |
| 2017 | $7,304 | $350,500 | $136,100 | $214,400 |
| 2016 | $7,161 | $350,500 | $136,100 | $214,400 |
| 2015 | $6,618 | $309,400 | $135,000 | $174,400 |
| 2014 | $6,432 | $309,400 | $135,000 | $174,400 |
| 2013 | $6,330 | $309,400 | $135,000 | $174,400 |
Source: Public Records
Map
Nearby Homes