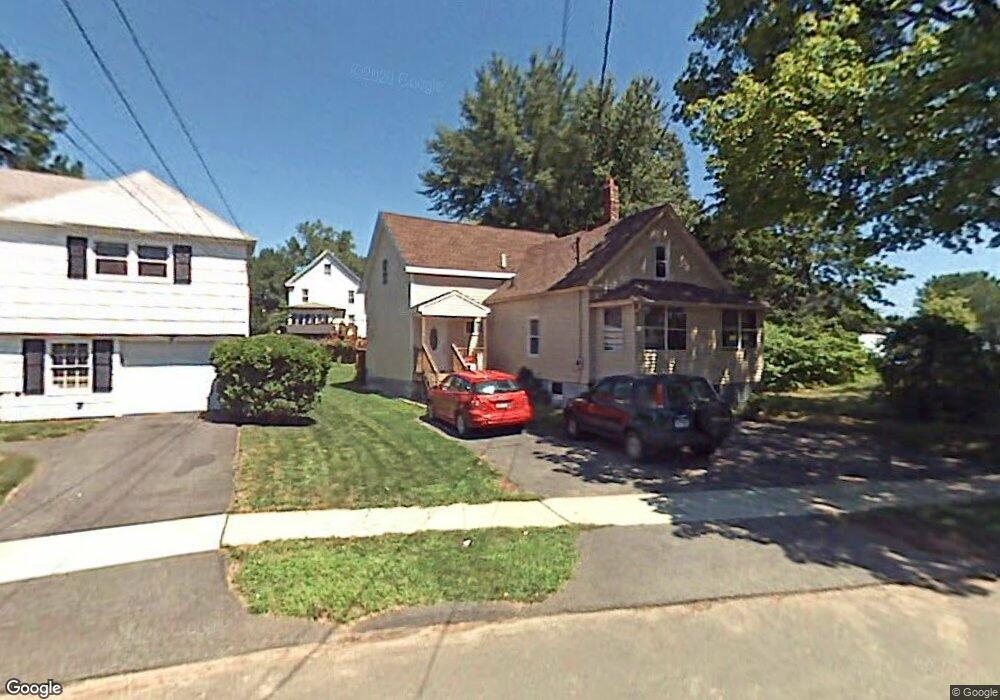
18 Corey St Windsor, CT 06095
Wilson NeighborhoodEstimated Value: $272,000 - $339,000
4
Beds
2
Baths
1,454
Sq Ft
$215/Sq Ft
Est. Value
About This Home
This home is located at 18 Corey St, Windsor, CT 06095 and is currently estimated at $312,653, approximately $215 per square foot. 18 Corey St is a home located in Hartford County with nearby schools including Poquonock Elementary School, Clover Street School, and Sage Park Middle School.
Ownership History
Date
Name
Owned For
Owner Type
Purchase Details
Closed on
Jul 7, 2005
Sold by
Abazq Nedzad and Abazq Mirna
Bought by
Lee Chuer and Lee Mona
Current Estimated Value
Home Financials for this Owner
Home Financials are based on the most recent Mortgage that was taken out on this home.
Original Mortgage
$159,200
Outstanding Balance
$92,135
Interest Rate
7.49%
Mortgage Type
Purchase Money Mortgage
Estimated Equity
$220,518
Purchase Details
Closed on
May 21, 2002
Sold by
Andress Dale and Andress Julie
Bought by
Abaza Nedzad and Abaza Mirna
Home Financials for this Owner
Home Financials are based on the most recent Mortgage that was taken out on this home.
Original Mortgage
$73,384
Interest Rate
7.15%
Mortgage Type
Purchase Money Mortgage
Purchase Details
Closed on
Jul 30, 2001
Sold by
Vozzolo Diane
Bought by
Andress Dale and Andress Julie
Purchase Details
Closed on
Nov 24, 1999
Sold by
Bouchard Carol
Bought by
Vozzolo Diane
Create a Home Valuation Report for This Property
The Home Valuation Report is an in-depth analysis detailing your home's value as well as a comparison with similar homes in the area
Home Values in the Area
Average Home Value in this Area
Purchase History
| Date | Buyer | Sale Price | Title Company |
|---|---|---|---|
| Lee Chuer | $199,000 | -- | |
| Abaza Nedzad | $74,000 | -- | |
| Andress Dale | $67,000 | -- | |
| Vozzolo Diane | $59,900 | -- |
Source: Public Records
Mortgage History
| Date | Status | Borrower | Loan Amount |
|---|---|---|---|
| Open | Vozzolo Diane | $159,200 | |
| Closed | Vozzolo Diane | $39,800 | |
| Previous Owner | Vozzolo Diane | $116,200 | |
| Previous Owner | Vozzolo Diane | $73,384 |
Source: Public Records
Tax History
| Year | Tax Paid | Tax Assessment Tax Assessment Total Assessment is a certain percentage of the fair market value that is determined by local assessors to be the total taxable value of land and additions on the property. | Land | Improvement |
|---|---|---|---|---|
| 2025 | $5,627 | $178,920 | $42,560 | $136,360 |
| 2024 | $5,962 | $178,920 | $42,560 | $136,360 |
| 2023 | $3,835 | $104,790 | $29,540 | $75,250 |
| 2022 | $3,801 | $104,790 | $29,540 | $75,250 |
| 2021 | $3,801 | $104,790 | $29,540 | $75,250 |
| 2020 | $3,784 | $104,790 | $29,540 | $75,250 |
| 2019 | $3,707 | $104,790 | $29,540 | $75,250 |
| 2018 | $3,630 | $100,940 | $29,540 | $71,400 |
| 2017 | $3,212 | $98,980 | $29,540 | $69,440 |
| 2016 | $3,120 | $98,980 | $29,540 | $69,440 |
| 2015 | $3,060 | $98,980 | $29,540 | $69,440 |
| 2014 | $3,016 | $98,980 | $29,540 | $69,440 |
Source: Public Records
Map
Nearby Homes
Your Personal Tour Guide
Ask me questions while you tour the home.