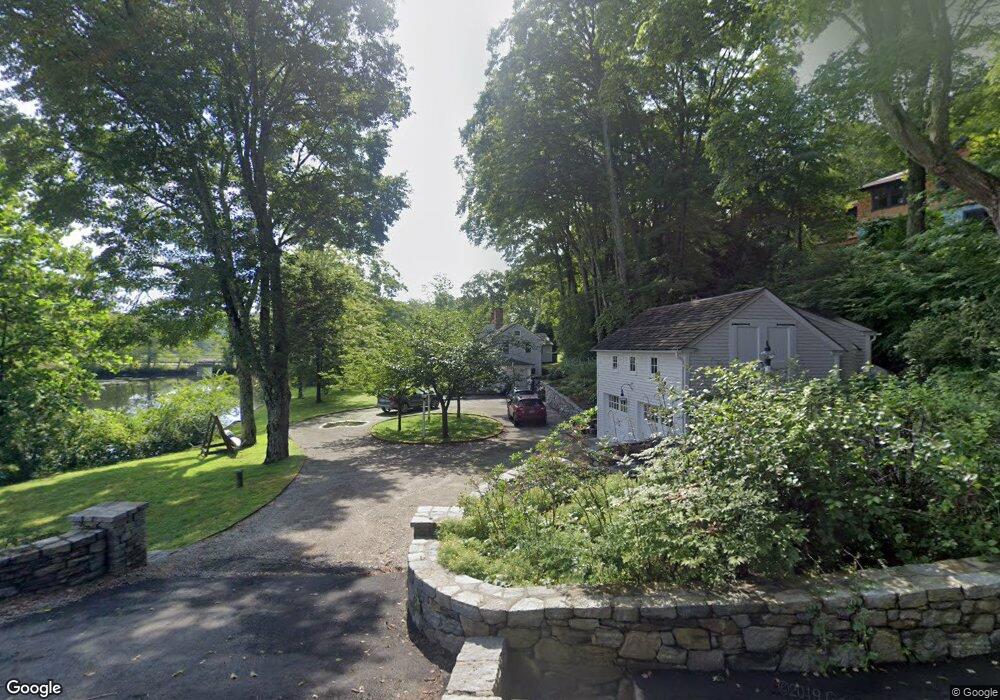
18 Cove Rd Old Lyme, CT 06371
Estimated Value: $1,226,000 - $1,591,000
4
Beds
4
Baths
3,239
Sq Ft
$424/Sq Ft
Est. Value
About This Home
This home is located at 18 Cove Rd, Old Lyme, CT 06371 and is currently estimated at $1,374,120, approximately $424 per square foot. 18 Cove Rd is a home located in New London County with nearby schools including Lyme Consolidated School, Lyme-Old Lyme Middle School, and Lyme-Old Lyme High School.
Ownership History
Date
Name
Owned For
Owner Type
Purchase Details
Closed on
Dec 27, 2011
Sold by
Snyder Todd R
Bought by
Boyer Phoebe C and Bennet John S
Current Estimated Value
Home Financials for this Owner
Home Financials are based on the most recent Mortgage that was taken out on this home.
Original Mortgage
$750,000
Outstanding Balance
$86,245
Interest Rate
3.99%
Estimated Equity
$1,287,875
Purchase Details
Closed on
Jul 29, 1996
Sold by
Bennett Douglas J and Bennett John S
Bought by
Snyder Todd R and Boyer Phoebe C
Create a Home Valuation Report for This Property
The Home Valuation Report is an in-depth analysis detailing your home's value as well as a comparison with similar homes in the area
Home Values in the Area
Average Home Value in this Area
Purchase History
| Date | Buyer | Sale Price | Title Company |
|---|---|---|---|
| Boyer Phoebe C | -- | -- | |
| Snyder Todd R | -- | -- | |
| Snyder Todd R | $280,487 | -- |
Source: Public Records
Mortgage History
| Date | Status | Borrower | Loan Amount |
|---|---|---|---|
| Open | Snyder Todd R | $750,000 | |
| Previous Owner | Snyder Todd R | $600,000 | |
| Previous Owner | Snyder Todd R | $600,000 |
Source: Public Records
Tax History Compared to Growth
Tax History
| Year | Tax Paid | Tax Assessment Tax Assessment Total Assessment is a certain percentage of the fair market value that is determined by local assessors to be the total taxable value of land and additions on the property. | Land | Improvement |
|---|---|---|---|---|
| 2025 | $11,438 | $788,800 | $272,100 | $516,700 |
| 2024 | $11,438 | $788,800 | $272,100 | $516,700 |
| 2023 | $11,203 | $574,500 | $194,200 | $380,300 |
| 2022 | $11,461 | $574,500 | $194,200 | $380,300 |
| 2021 | $11,461 | $574,500 | $194,200 | $380,300 |
| 2020 | $11,461 | $574,500 | $194,200 | $380,300 |
| 2019 | $11,461 | $574,500 | $194,200 | $380,300 |
| 2018 | $11,491 | $617,800 | $226,900 | $390,900 |
| 2017 | $11,275 | $617,800 | $226,900 | $390,900 |
| 2016 | $11,275 | $617,800 | $226,900 | $390,900 |
| 2015 | $10,966 | $617,800 | $226,900 | $390,900 |
| 2014 | $10,503 | $617,800 | $226,900 | $390,900 |
Source: Public Records
Map
Nearby Homes