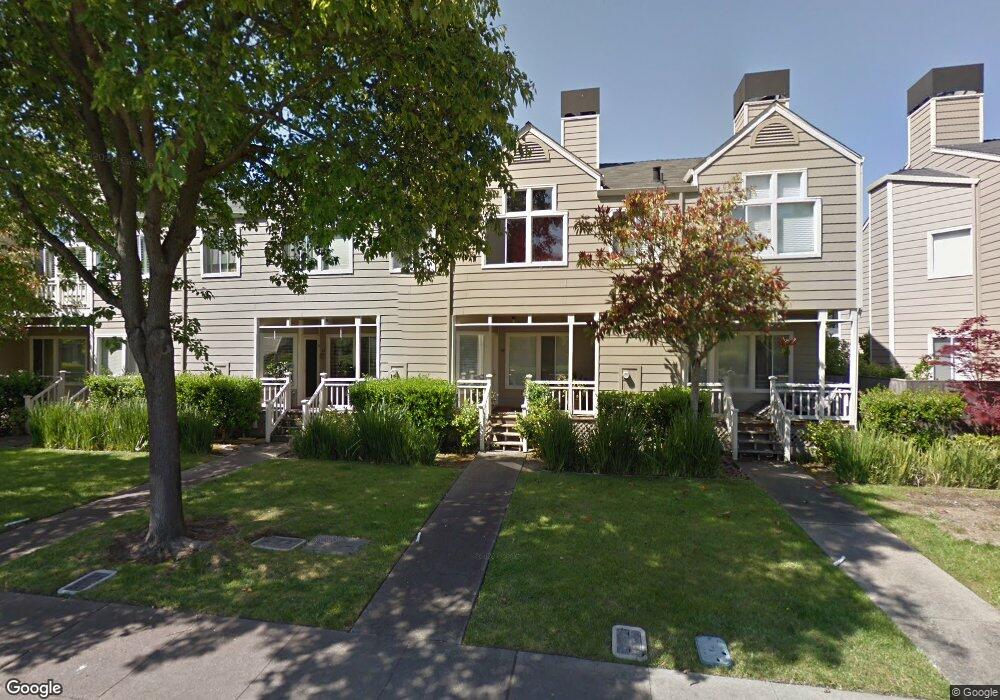
18 Creekside Ct Corte Madera, CA 94925
Estimated Value: $1,046,000 - $1,232,000
3
Beds
3
Baths
1,446
Sq Ft
$802/Sq Ft
Est. Value
About This Home
This home is located at 18 Creekside Ct, Corte Madera, CA 94925 and is currently estimated at $1,159,378, approximately $801 per square foot. 18 Creekside Ct is a home located in Marin County with nearby schools including The Cove School, Hall Middle School, and Redwood High School.
Ownership History
Date
Name
Owned For
Owner Type
Purchase Details
Closed on
Jan 8, 2020
Sold by
Anderson Margaret Jean
Bought by
Tong Richard D and Tong Sophia K
Current Estimated Value
Home Financials for this Owner
Home Financials are based on the most recent Mortgage that was taken out on this home.
Original Mortgage
$300,000
Outstanding Balance
$265,062
Interest Rate
3.6%
Mortgage Type
New Conventional
Estimated Equity
$894,316
Purchase Details
Closed on
Jan 15, 2009
Sold by
Katz Harvey A and Katz Mary F
Bought by
Anderson Margaret Jean
Purchase Details
Closed on
Feb 15, 2002
Sold by
Katz Harvey A and Katz Mary F
Bought by
Katz Harvey A and Katz Mary F
Home Financials for this Owner
Home Financials are based on the most recent Mortgage that was taken out on this home.
Original Mortgage
$300,000
Interest Rate
6.8%
Purchase Details
Closed on
Mar 17, 1995
Sold by
Katz Harvey A and Katz Mary F
Bought by
Katz Harvey A and Katz Mary F
Create a Home Valuation Report for This Property
The Home Valuation Report is an in-depth analysis detailing your home's value as well as a comparison with similar homes in the area
Home Values in the Area
Average Home Value in this Area
Purchase History
| Date | Buyer | Sale Price | Title Company |
|---|---|---|---|
| Tong Richard D | $949,000 | First American Title Company | |
| Anderson Margaret Jean | $670,000 | First American Title Company | |
| Katz Harvey A | -- | California Land Title Co | |
| Katz Harvey A | -- | -- |
Source: Public Records
Mortgage History
| Date | Status | Borrower | Loan Amount |
|---|---|---|---|
| Open | Tong Richard D | $300,000 | |
| Previous Owner | Katz Harvey A | $300,000 |
Source: Public Records
Tax History
| Year | Tax Paid | Tax Assessment Tax Assessment Total Assessment is a certain percentage of the fair market value that is determined by local assessors to be the total taxable value of land and additions on the property. | Land | Improvement |
|---|---|---|---|---|
| 2025 | $14,762 | $1,037,854 | $519,474 | $518,380 |
| 2024 | $14,082 | $1,017,508 | $509,290 | $508,218 |
| 2023 | $13,572 | $997,559 | $499,305 | $498,254 |
| 2022 | $13,442 | $978,001 | $489,516 | $488,485 |
| 2021 | $13,211 | $958,831 | $479,921 | $478,910 |
| 2020 | $6,749 | $433,897 | $175,008 | $258,889 |
| 2019 | $5,602 | $425,392 | $171,578 | $253,814 |
| 2018 | $5,594 | $417,053 | $168,214 | $248,839 |
| 2017 | $5,615 | $408,878 | $164,917 | $243,961 |
| 2016 | $5,399 | $400,860 | $161,683 | $239,177 |
| 2015 | $5,423 | $394,841 | $159,255 | $235,586 |
| 2014 | $5,191 | $387,110 | $156,137 | $230,973 |
Source: Public Records
Map
Nearby Homes
- 37 Creekside Ct
- 111 Parkview Cir
- 4 Meadow Ridge Dr
- 137 Koch Rd
- 1411 Casa Buena Dr Unit 31
- 1411 Casa Buena Dr Unit 13
- 1411 Casa Buena Dr Unit 45
- 125 Mariner Green Ct
- 1425 Casa Buena Dr Unit 108
- 14 Mariner Green Dr
- 41 Spindrift Passage
- 0 Meadowsweet Dr
- 1163 Meadowsweet Dr
- 815 Meadowsweet Dr
- 834 Meadowsweet Dr
- 801 Meadowsweet Dr
- 319 Golden Hind Passage
- 42 Underhill Rd
- 31 Via Los Altos
- 0 Eagle Rock Rd
- 14 Creekside Ct
- 22 Creekside Ct
- 30 Creekside Ct Unit 19
- 10 Creekside Ct
- 26 Creekside Ct Unit 17
- 6 Creekside Ct
- 34 Creekside Ct
- 2 Creekside Ct
- 40 Creekside Ct
- 11 Creekside Ct
- 89 Parkview Cir
- 21 Creekside Ct
- 87 Parkview Cir
- 79 Parkview Cir Unit 21
- 71 Parkview Cir
- 65 Parkview Cir
- 42 Creekside Ct
- 73 Parkview Cir
- 59 Parkview Cir
- 23 Creekside Ct
Your Personal Tour Guide
Ask me questions while you tour the home.