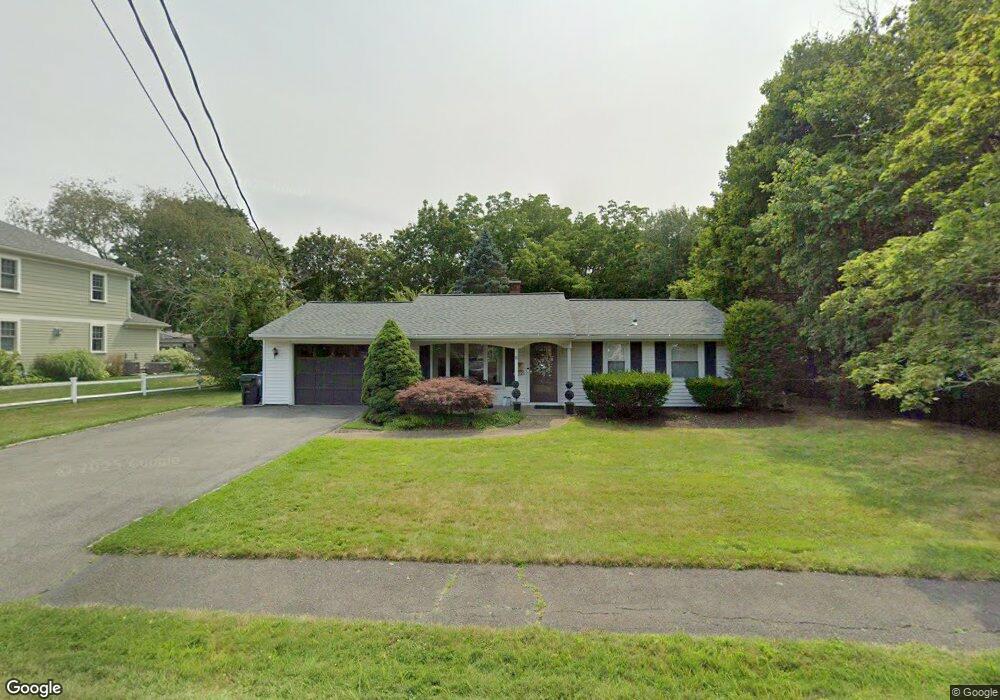
18 Dartmouth St Danvers, MA 01923
Estimated Value: $642,362 - $678,000
3
Beds
2
Baths
1,120
Sq Ft
$591/Sq Ft
Est. Value
About This Home
This home is located at 18 Dartmouth St, Danvers, MA 01923 and is currently estimated at $661,591, approximately $590 per square foot. 18 Dartmouth St is a home located in Essex County with nearby schools including St. Mary of the Annunciation School and St. John's Prep.
Ownership History
Date
Name
Owned For
Owner Type
Purchase Details
Closed on
May 17, 1993
Sold by
Schoene Juergen P and Schoene Ursula B
Bought by
Orlando Peter G and Orlando Leslie
Current Estimated Value
Create a Home Valuation Report for This Property
The Home Valuation Report is an in-depth analysis detailing your home's value as well as a comparison with similar homes in the area
Home Values in the Area
Average Home Value in this Area
Purchase History
| Date | Buyer | Sale Price | Title Company |
|---|---|---|---|
| Orlando Peter G | $139,000 | -- |
Source: Public Records
Mortgage History
| Date | Status | Borrower | Loan Amount |
|---|---|---|---|
| Open | Orlando Peter G | $50,000 | |
| Open | Orlando Peter G | $200,000 | |
| Closed | Orlando Peter G | $150,000 | |
| Closed | Orlando Peter G | $150,000 |
Source: Public Records
Tax History Compared to Growth
Tax History
| Year | Tax Paid | Tax Assessment Tax Assessment Total Assessment is a certain percentage of the fair market value that is determined by local assessors to be the total taxable value of land and additions on the property. | Land | Improvement |
|---|---|---|---|---|
| 2025 | $5,961 | $542,400 | $366,100 | $176,300 |
| 2024 | $5,973 | $537,600 | $366,100 | $171,500 |
| 2023 | $5,800 | $493,600 | $332,700 | $160,900 |
| 2022 | $5,678 | $448,500 | $301,800 | $146,700 |
| 2021 | $5,476 | $410,200 | $285,900 | $124,300 |
| 2020 | $5,383 | $412,200 | $282,600 | $129,600 |
| 2019 | $5,125 | $385,900 | $256,900 | $129,000 |
| 2018 | $4,984 | $368,100 | $254,300 | $113,800 |
| 2017 | $4,745 | $334,400 | $222,200 | $112,200 |
| 2016 | $4,527 | $318,800 | $211,900 | $106,900 |
| 2015 | $4,316 | $289,500 | $192,700 | $96,800 |
Source: Public Records
Map
Nearby Homes