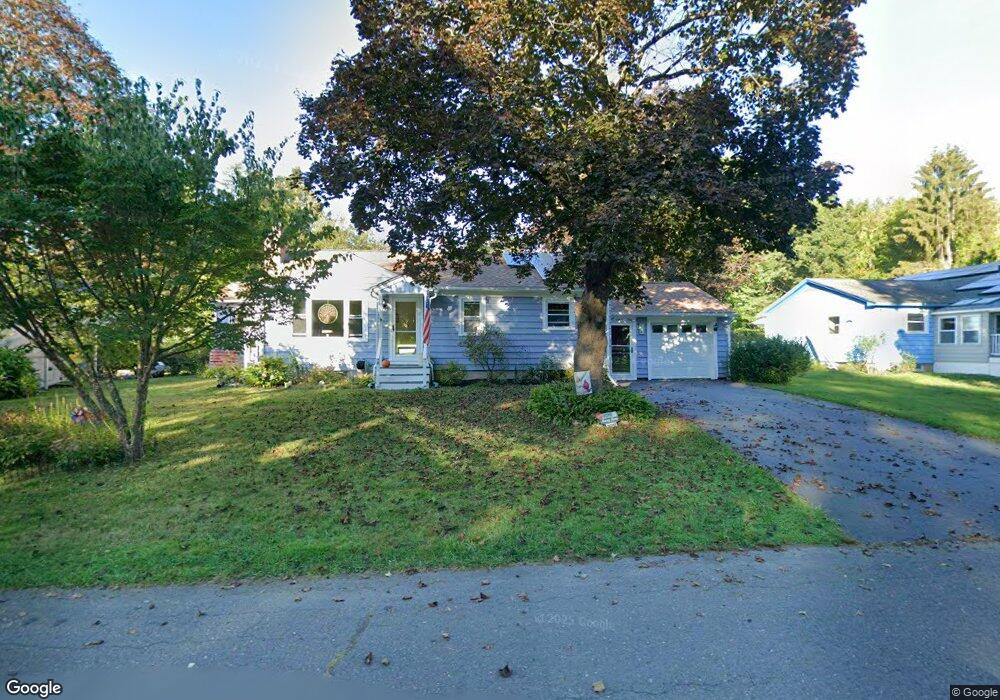
18 Denise Ct Northampton, MA 01060
Estimated Value: $450,075 - $516,000
2
Beds
1
Bath
1,102
Sq Ft
$433/Sq Ft
Est. Value
About This Home
This home is located at 18 Denise Ct, Northampton, MA 01060 and is currently estimated at $477,019, approximately $432 per square foot. 18 Denise Ct is a home located in Hampshire County with nearby schools including Northampton High School, The Montessori School of Northampton, and Lander Grinspoon Academy.
Ownership History
Date
Name
Owned For
Owner Type
Purchase Details
Closed on
Apr 27, 1999
Sold by
Roberts Lawrence P
Bought by
Ginga Donna A and Stewart Alicia M
Current Estimated Value
Purchase Details
Closed on
Nov 23, 1992
Sold by
Driscoll Robert W and Driscoll Maureen M
Bought by
Roberts Helen M
Create a Home Valuation Report for This Property
The Home Valuation Report is an in-depth analysis detailing your home's value as well as a comparison with similar homes in the area
Home Values in the Area
Average Home Value in this Area
Purchase History
| Date | Buyer | Sale Price | Title Company |
|---|---|---|---|
| Ginga Donna A | $125,000 | -- | |
| Roberts Helen M | $125,000 | -- |
Source: Public Records
Mortgage History
| Date | Status | Borrower | Loan Amount |
|---|---|---|---|
| Open | Roberts Helen M | $127,500 | |
| Closed | Roberts Helen M | $10,000 | |
| Closed | Roberts Helen M | $117,600 |
Source: Public Records
Tax History
| Year | Tax Paid | Tax Assessment Tax Assessment Total Assessment is a certain percentage of the fair market value that is determined by local assessors to be the total taxable value of land and additions on the property. | Land | Improvement |
|---|---|---|---|---|
| 2025 | $5,767 | $414,000 | $184,400 | $229,600 |
| 2024 | $5,392 | $355,000 | $167,700 | $187,300 |
| 2023 | $5,606 | $353,900 | $152,400 | $201,500 |
| 2022 | $5,219 | $291,700 | $142,500 | $149,200 |
| 2021 | $4,471 | $257,400 | $135,800 | $121,600 |
| 2020 | $4,324 | $257,400 | $135,800 | $121,600 |
| 2019 | $4,353 | $250,600 | $135,800 | $114,800 |
| 2018 | $4,267 | $250,400 | $135,800 | $114,600 |
| 2017 | $4,179 | $250,400 | $135,800 | $114,600 |
| 2016 | $4,046 | $250,400 | $135,800 | $114,600 |
| 2015 | $3,664 | $231,900 | $120,800 | $111,100 |
| 2014 | $3,569 | $231,900 | $120,800 | $111,100 |
Source: Public Records
Map
Nearby Homes
- 13A Finn St
- 80 Damon Rd Unit 5104
- 80 Damon Rd Unit 4302
- 289 Hatfield St
- 37 Finn St
- 61 Crescent St Unit 8
- 61 Crescent St Unit 7
- 22 Woodbine Ave
- 20 View Ave Unit A
- 30 View Ave
- 61 Woodlawn Ave
- 0 Terrace Ln
- 35 Hubbard Ave
- 50 Union St Unit 18
- 218 Elm St
- 25 Union St
- 25 Union St Unit 2
- 30 Graves Ave Unit B
- 88 Pines Edge Dr Unit 88
- 61 Harrison Ave
Your Personal Tour Guide
Ask me questions while you tour the home.