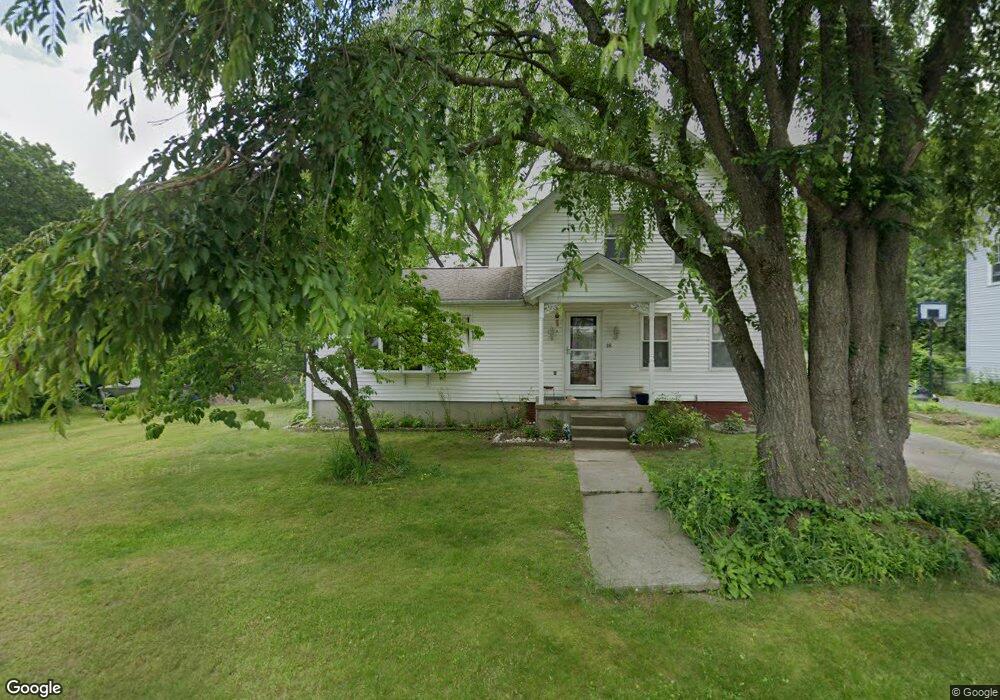
18 E Green St Easthampton, MA 01027
Estimated Value: $357,000 - $415,000
3
Beds
1
Bath
1,475
Sq Ft
$255/Sq Ft
Est. Value
About This Home
This home is located at 18 E Green St, Easthampton, MA 01027 and is currently estimated at $376,139, approximately $255 per square foot. 18 E Green St is a home located in Hampshire County with nearby schools including Easthampton High School, Tri-County Schools, and New England Adolescent Research Institute.
Ownership History
Date
Name
Owned For
Owner Type
Purchase Details
Closed on
Dec 29, 2014
Sold by
Yann Phariya H and Yann Ven
Bought by
Yann Phariya H and Yann Ven
Current Estimated Value
Home Financials for this Owner
Home Financials are based on the most recent Mortgage that was taken out on this home.
Original Mortgage
$184,000
Outstanding Balance
$104,165
Interest Rate
4.02%
Mortgage Type
New Conventional
Estimated Equity
$271,974
Purchase Details
Closed on
Mar 23, 2007
Sold by
Sim Chaid and Sim Phariya H
Bought by
Sim Phariya H
Purchase Details
Closed on
Jul 31, 1996
Sold by
Lenkowski Marguerite G and Lenowski Marguerite P
Bought by
Hinds Phariya
Create a Home Valuation Report for This Property
The Home Valuation Report is an in-depth analysis detailing your home's value as well as a comparison with similar homes in the area
Home Values in the Area
Average Home Value in this Area
Purchase History
| Date | Buyer | Sale Price | Title Company |
|---|---|---|---|
| Yann Phariya H | -- | -- | |
| Sim Phariya H | -- | -- | |
| Hinds Phariya | $101,000 | -- |
Source: Public Records
Mortgage History
| Date | Status | Borrower | Loan Amount |
|---|---|---|---|
| Open | Yann Phariya H | $184,000 | |
| Previous Owner | Hinds Phariya | $177,951 | |
| Previous Owner | Hinds Phariya | $50,000 | |
| Previous Owner | Hinds Phariya | $100,000 | |
| Previous Owner | Hinds Phariya | $66,900 |
Source: Public Records
Tax History
| Year | Tax Paid | Tax Assessment Tax Assessment Total Assessment is a certain percentage of the fair market value that is determined by local assessors to be the total taxable value of land and additions on the property. | Land | Improvement |
|---|---|---|---|---|
| 2025 | $4,394 | $321,400 | $113,300 | $208,100 |
| 2024 | $4,243 | $312,900 | $110,000 | $202,900 |
| 2023 | $3,255 | $222,200 | $86,900 | $135,300 |
| 2022 | $3,673 | $222,200 | $86,900 | $135,300 |
| 2021 | $4,011 | $228,700 | $86,900 | $141,800 |
| 2020 | $3,946 | $222,200 | $86,900 | $135,300 |
| 2019 | $3,254 | $210,500 | $86,900 | $123,600 |
| 2018 | $3,144 | $196,500 | $82,000 | $114,500 |
| 2017 | $3,067 | $189,200 | $78,600 | $110,600 |
| 2016 | $2,929 | $187,900 | $78,600 | $109,300 |
| 2015 | $2,847 | $187,900 | $78,600 | $109,300 |
Source: Public Records
Map
Nearby Homes
- 40 Clark St
- 4 Gaugh St
- 2 Oak St
- 33 Knipfer Ave
- 19 Nicols Way Unit 19
- 7 Union Ct
- 12 Glen Cove Place Unit B
- 18-20 Oakdale Place
- 10 Glen Cove Place Unit A
- 36 & 36R Holly Cir
- 6 S St & Abutting Lots
- 2 W Park Dr
- 6 Wilton Rd
- 41 South St Unit 11
- 336 Main St
- 11 Dragon Cir
- 211 East St Unit 11
- 245 Park St
- 385 Main St
- 4 Laurel Dr
Your Personal Tour Guide
Ask me questions while you tour the home.