J
Seller's Agent in 2023
John Veit
Coldwell Banker Realty
(860) 833-9084
1 in this area
38 Total Sales
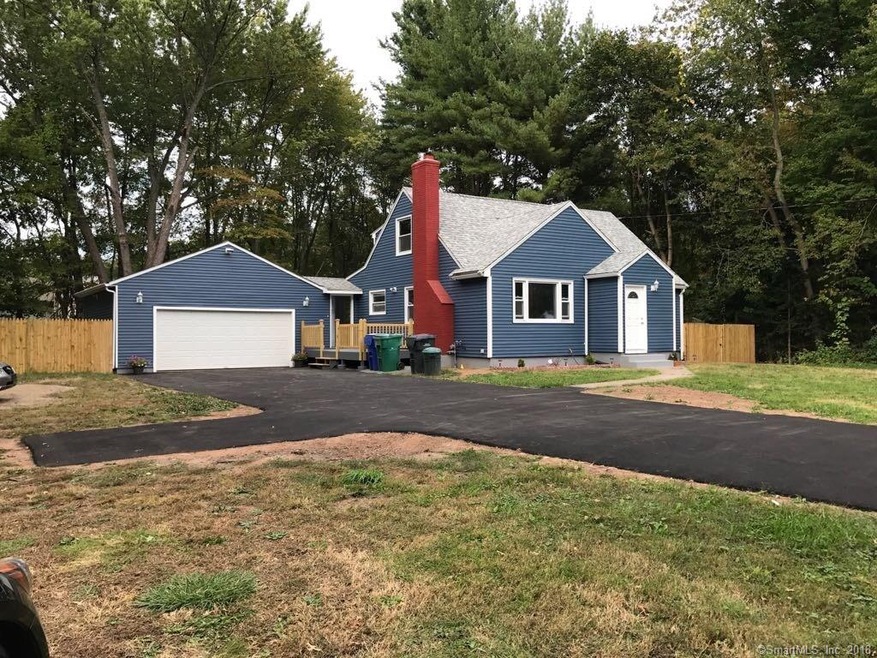
Back on the market ready for a serious buyer. Great for first time home buyer. This property it totally redone. Property converted to gas, New windows, Beautiful hardwood floors, 1 fire place, Sky lights, New electrical, New Plumbing, New deck, New driveway, New Roof, New kitchen and bathrooms with new cabinets marble counter tops great tile work through-out. This property is a must see. Enclosed backyard new fence, Close to highway, close to schools, close to shopping centers also close to bus lines.
Last Agent to Sell the Property
Shawn Aldridge
Agnelli Real Estate Listed on: 10/14/2017
| Date | Type | Sale Price | Title Company |
|---|---|---|---|
| Warranty Deed | $320,000 | None Available | |
| Warranty Deed | $320,000 | None Available | |
| Warranty Deed | $320,000 | None Available | |
| Warranty Deed | $210,400 | -- | |
| Warranty Deed | $199,990 | -- | |
| Warranty Deed | $80,000 | -- | |
| Foreclosure Deed | -- | -- | |
| Warranty Deed | $239,990 | -- | |
| Warranty Deed | $100,000 | -- | |
| Warranty Deed | $210,400 | -- | |
| Warranty Deed | $199,990 | -- | |
| Warranty Deed | $80,000 | -- | |
| Foreclosure Deed | -- | -- | |
| Warranty Deed | $239,990 | -- | |
| Warranty Deed | $100,000 | -- |
| Date | Status | Loan Amount | Loan Type |
|---|---|---|---|
| Open | $304,000 | Purchase Money Mortgage | |
| Closed | $304,000 | Purchase Money Mortgage | |
| Previous Owner | $214,500 | FHA |
| Date | Event | Price | Change | Sq Ft Price |
|---|---|---|---|---|
| 09/01/2023 09/01/23 | Sold | $318,800 | -0.3% | $189 / Sq Ft |
| 07/14/2023 07/14/23 | Pending | -- | -- | -- |
| 07/07/2023 07/07/23 | For Sale | $319,900 | +60.0% | $190 / Sq Ft |
| 04/04/2018 04/04/18 | Sold | $199,990 | 0.0% | $110 / Sq Ft |
| 12/26/2017 12/26/17 | Off Market | $199,990 | -- | -- |
| 11/27/2017 11/27/17 | For Sale | $199,900 | 0.0% | $110 / Sq Ft |
| 11/21/2017 11/21/17 | Pending | -- | -- | -- |
| 11/06/2017 11/06/17 | Price Changed | $199,900 | -4.8% | $110 / Sq Ft |
| 10/14/2017 10/14/17 | For Sale | $209,900 | +162.4% | $115 / Sq Ft |
| 05/18/2017 05/18/17 | Sold | $80,000 | 0.0% | $44 / Sq Ft |
| 04/18/2017 04/18/17 | Off Market | $80,000 | -- | -- |
| 03/26/2017 03/26/17 | For Sale | $99,900 | -- | $55 / Sq Ft |
| Year | Tax Paid | Tax Assessment Tax Assessment Total Assessment is a certain percentage of the fair market value that is determined by local assessors to be the total taxable value of land and additions on the property. | Land | Improvement |
|---|---|---|---|---|
| 2025 | $8,133 | $209,930 | $47,110 | $162,820 |
| 2024 | $5,523 | $136,080 | $39,410 | $96,670 |
| 2023 | $5,427 | $136,080 | $39,410 | $96,670 |
| 2022 | $5,039 | $136,080 | $39,410 | $96,670 |
| 2021 | $5,182 | $136,080 | $39,410 | $96,670 |
| 2020 | $5,104 | $136,080 | $39,410 | $96,670 |
| 2019 | $5,390 | $134,890 | $39,410 | $95,480 |
| 2018 | $5,734 | $143,290 | $38,640 | $104,650 |
| 2017 | $4,776 | $119,210 | $38,640 | $80,570 |
| 2016 | $4,667 | $119,210 | $38,640 | $80,570 |
| 2015 | $4,590 | $119,210 | $38,640 | $80,570 |
| 2014 | $4,945 | $132,440 | $49,910 | $82,530 |
J
Seller's Agent in 2023
John Veit
Coldwell Banker Realty
(860) 833-9084
1 in this area
38 Total Sales

Buyer's Agent in 2023
Sheneen Williams
Dalhouse Real Estate
(860) 597-8426
7 in this area
38 Total Sales
S
Seller's Agent in 2018
Shawn Aldridge
Agnelli Real Estate
Buyer's Agent in 2018
Cynthia Rabb
eXp Realty
(860) 459-8985
10 in this area
92 Total Sales
T
Seller's Agent in 2017
Terry Spada
Berkshire Hathaway Home Services
(860) 306-3063
26 Total Sales
Source: SmartMLS
MLS Number: 170024254
APN: BLOO-001791-000000-000004-A000000
Disclaimer: Certain information contained herein is derived from information provided by parties other than Homes.com. All information provided is deemed reliable, but is not guaranteed to be accurate and should be independently verified.
![]() IDX information is provided exclusively for personal, non-commercial use, and may not be used for any purpose other than to identify prospective properties consumers may be interested in purchasing. Information is deemed reliable but not guaranteed.
IDX information is provided exclusively for personal, non-commercial use, and may not be used for any purpose other than to identify prospective properties consumers may be interested in purchasing. Information is deemed reliable but not guaranteed.