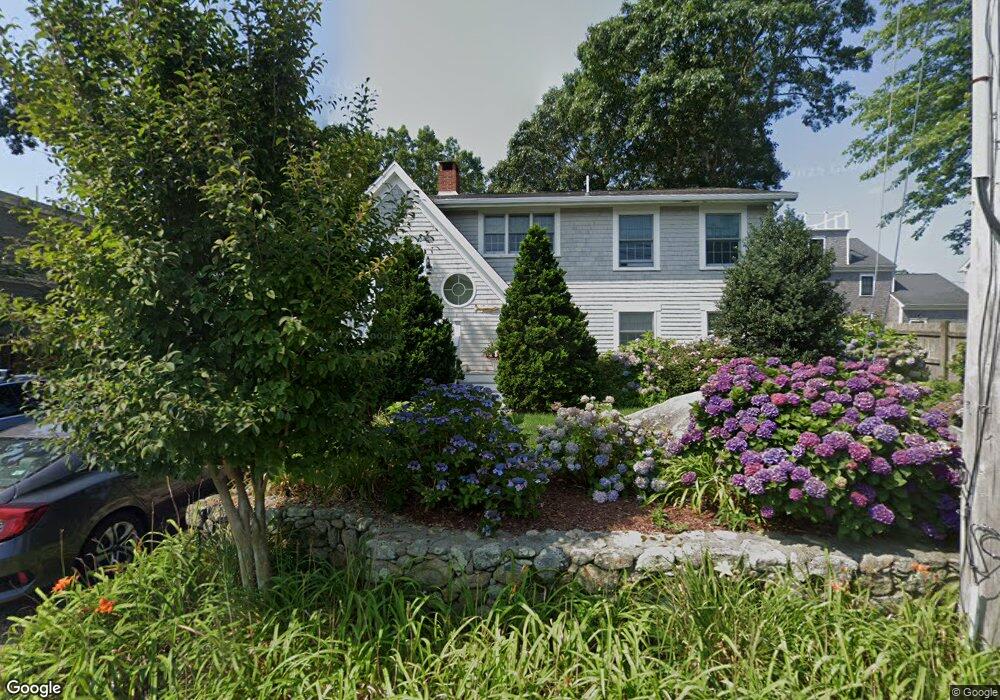
18 East Ave Marion, MA 02738
Estimated Value: $1,130,000 - $1,341,000
4
Beds
2
Baths
1,944
Sq Ft
$629/Sq Ft
Est. Value
About This Home
This home is located at 18 East Ave, Marion, MA 02738 and is currently estimated at $1,222,749, approximately $628 per square foot. 18 East Ave is a home located in Plymouth County with nearby schools including Old Rochester Regional High School.
Ownership History
Date
Name
Owned For
Owner Type
Purchase Details
Closed on
Oct 3, 2005
Sold by
Cosman Charles M and Cosman Dianne M
Bought by
Nazzari Joseph T and Nazzari Antoinette C
Current Estimated Value
Purchase Details
Closed on
Sep 4, 2002
Sold by
Robin Thomas J and Robin Lepore J
Bought by
Cosman Charles M and Cosman Dianne M
Home Financials for this Owner
Home Financials are based on the most recent Mortgage that was taken out on this home.
Original Mortgage
$175,000
Interest Rate
6.39%
Mortgage Type
Purchase Money Mortgage
Purchase Details
Closed on
Dec 20, 1991
Sold by
Finnegan Lawrence J and Finnegan Joyce G
Bought by
Robin Thomas J and Robin Lepore J
Home Financials for this Owner
Home Financials are based on the most recent Mortgage that was taken out on this home.
Original Mortgage
$184,000
Interest Rate
8.68%
Mortgage Type
Purchase Money Mortgage
Create a Home Valuation Report for This Property
The Home Valuation Report is an in-depth analysis detailing your home's value as well as a comparison with similar homes in the area
Home Values in the Area
Average Home Value in this Area
Purchase History
| Date | Buyer | Sale Price | Title Company |
|---|---|---|---|
| Nazzari Joseph T | $630,000 | -- | |
| Cosman Charles M | $460,000 | -- | |
| Robin Thomas J | $207,500 | -- |
Source: Public Records
Mortgage History
| Date | Status | Borrower | Loan Amount |
|---|---|---|---|
| Previous Owner | Cosman Charles M | $175,000 | |
| Previous Owner | Robin Thomas J | $184,000 | |
| Previous Owner | Robin Thomas J | $184,000 |
Source: Public Records
Tax History Compared to Growth
Tax History
| Year | Tax Paid | Tax Assessment Tax Assessment Total Assessment is a certain percentage of the fair market value that is determined by local assessors to be the total taxable value of land and additions on the property. | Land | Improvement |
|---|---|---|---|---|
| 2025 | $9,679 | $1,038,526 | $554,926 | $483,600 |
| 2024 | $7,930 | $856,403 | $380,003 | $476,400 |
| 2023 | $9,341 | $989,494 | $548,894 | $440,600 |
| 2022 | $10,369 | $955,669 | $587,169 | $368,500 |
| 2021 | $9,717 | $858,399 | $518,599 | $339,800 |
| 2020 | $1,859 | $714,400 | $414,000 | $300,400 |
| 2019 | $7,472 | $677,400 | $377,000 | $300,400 |
| 2018 | $1,701 | $709,000 | $418,200 | $290,800 |
| 2017 | $7,761 | $680,200 | $418,200 | $262,000 |
| 2016 | $7,855 | $694,500 | $418,200 | $276,300 |
| 2015 | $7,830 | $704,800 | $412,300 | $292,500 |
Source: Public Records
Map
Nearby Homes