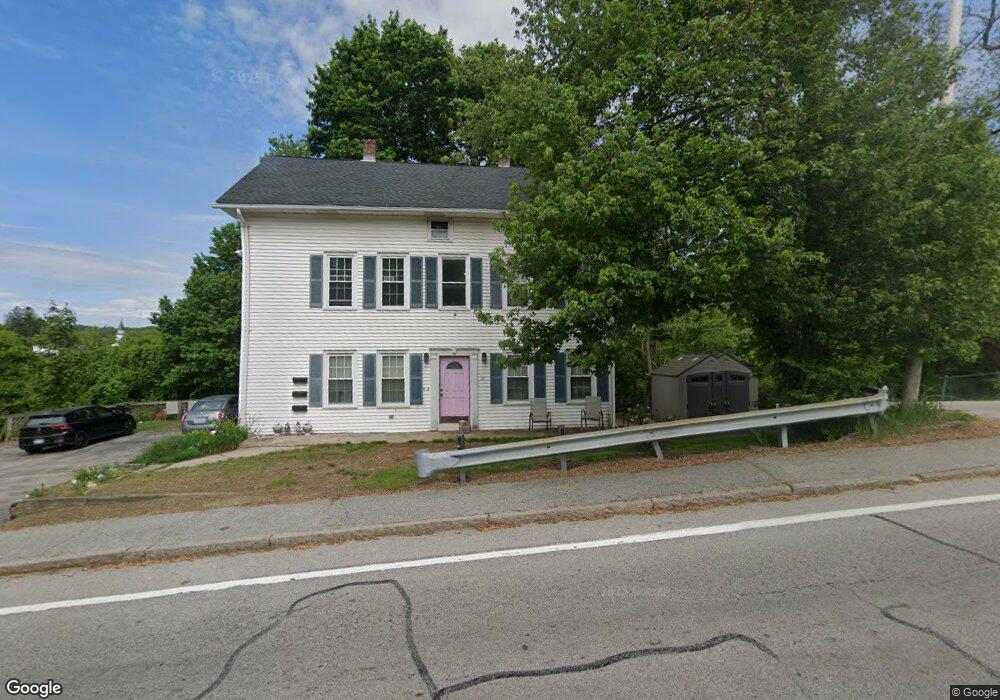
18 Fairview Ave West Warwick, RI 02893
West Warwick Centre NeighborhoodEstimated Value: $439,000 - $535,000
6
Beds
3
Baths
2,541
Sq Ft
$186/Sq Ft
Est. Value
About This Home
This home is located at 18 Fairview Ave, West Warwick, RI 02893 and is currently estimated at $472,667, approximately $186 per square foot. 18 Fairview Ave is a home located in Kent County with nearby schools including West Warwick High School and St Joseph School.
Ownership History
Date
Name
Owned For
Owner Type
Purchase Details
Closed on
May 23, 2013
Sold by
Centerville Savings Ba
Bought by
Mai Tai Investments
Current Estimated Value
Purchase Details
Closed on
Dec 18, 2012
Sold by
Marcotte Elene
Bought by
Centreville Savings Ba
Create a Home Valuation Report for This Property
The Home Valuation Report is an in-depth analysis detailing your home's value as well as a comparison with similar homes in the area
Home Values in the Area
Average Home Value in this Area
Purchase History
| Date | Buyer | Sale Price | Title Company |
|---|---|---|---|
| Mai Tai Investments | $55,000 | -- | |
| Centreville Savings Ba | $100,000 | -- |
Source: Public Records
Mortgage History
| Date | Status | Borrower | Loan Amount |
|---|---|---|---|
| Open | Centreville Savings Ba | $154,965 | |
| Previous Owner | Centreville Savings Ba | $165,000 |
Source: Public Records
Tax History Compared to Growth
Tax History
| Year | Tax Paid | Tax Assessment Tax Assessment Total Assessment is a certain percentage of the fair market value that is determined by local assessors to be the total taxable value of land and additions on the property. | Land | Improvement |
|---|---|---|---|---|
| 2025 | $6,092 | $398,400 | $85,100 | $313,300 |
| 2024 | $5,158 | $252,000 | $68,800 | $183,200 |
| 2023 | $5,058 | $252,000 | $68,800 | $183,200 |
| 2022 | $4,977 | $252,000 | $68,800 | $183,200 |
| 2021 | $6,462 | $216,200 | $55,000 | $161,200 |
| 2020 | $6,462 | $216,200 | $55,000 | $161,200 |
| 2019 | $6,339 | $216,200 | $55,000 | $161,200 |
| 2018 | $5,974 | $152,400 | $49,400 | $103,000 |
| 2017 | $5,784 | $152,400 | $49,400 | $103,000 |
| 2016 | $5,680 | $152,400 | $49,400 | $103,000 |
| 2015 | $5,579 | $149,700 | $49,400 | $100,300 |
| 2014 | $1,364 | $149,700 | $49,400 | $100,300 |
Source: Public Records
Map
Nearby Homes