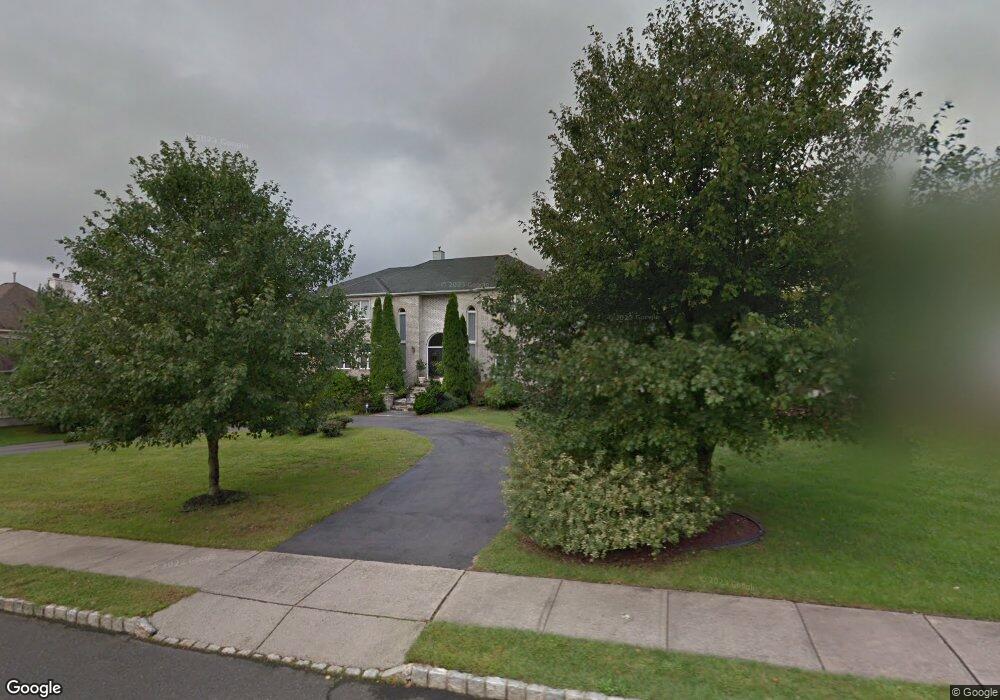
18 Forest Ct N Monmouth Junction, NJ 08852
Estimated Value: $971,000 - $1,399,000
--
Bed
--
Bath
--
Sq Ft
0.48
Acres
About This Home
This home is located at 18 Forest Ct N, Monmouth Junction, NJ 08852 and is currently estimated at $1,160,549. 18 Forest Ct N is a home located in Middlesex County with nearby schools including Cambridge Elementary School, Crossroads South Middle School, and South Brunswick High School.
Ownership History
Date
Name
Owned For
Owner Type
Purchase Details
Closed on
Sep 17, 2001
Sold by
Savage Evelyn
Bought by
Palermo Carlo and Palermo Luisa
Current Estimated Value
Home Financials for this Owner
Home Financials are based on the most recent Mortgage that was taken out on this home.
Original Mortgage
$400,000
Outstanding Balance
$154,842
Interest Rate
6.89%
Estimated Equity
$1,005,707
Purchase Details
Closed on
Nov 7, 1996
Sold by
Princeton Hills Estates
Bought by
Koroma Eidson
Home Financials for this Owner
Home Financials are based on the most recent Mortgage that was taken out on this home.
Original Mortgage
$395,000
Interest Rate
7.99%
Create a Home Valuation Report for This Property
The Home Valuation Report is an in-depth analysis detailing your home's value as well as a comparison with similar homes in the area
Home Values in the Area
Average Home Value in this Area
Purchase History
| Date | Buyer | Sale Price | Title Company |
|---|---|---|---|
| Palermo Carlo | $540,000 | -- | |
| Koroma Eidson | $503,633 | -- |
Source: Public Records
Mortgage History
| Date | Status | Borrower | Loan Amount |
|---|---|---|---|
| Open | Palermo Carlo | $400,000 | |
| Previous Owner | Koroma Eidson | $395,000 |
Source: Public Records
Tax History Compared to Growth
Tax History
| Year | Tax Paid | Tax Assessment Tax Assessment Total Assessment is a certain percentage of the fair market value that is determined by local assessors to be the total taxable value of land and additions on the property. | Land | Improvement |
|---|---|---|---|---|
| 2025 | $18,789 | $345,000 | $90,000 | $255,000 |
| 2024 | $18,113 | $345,000 | $90,000 | $255,000 |
| 2023 | $18,113 | $345,000 | $90,000 | $255,000 |
| 2022 | $17,581 | $345,000 | $90,000 | $255,000 |
| 2021 | $13,522 | $345,000 | $90,000 | $255,000 |
| 2020 | $17,678 | $345,000 | $90,000 | $255,000 |
| 2019 | $17,833 | $345,000 | $90,000 | $255,000 |
| 2018 | $17,250 | $345,000 | $90,000 | $255,000 |
| 2017 | $19,968 | $400,000 | $90,000 | $310,000 |
| 2016 | $19,756 | $400,000 | $90,000 | $310,000 |
| 2015 | $19,156 | $400,000 | $90,000 | $310,000 |
| 2014 | $18,848 | $400,000 | $90,000 | $310,000 |
Source: Public Records
Map
Nearby Homes