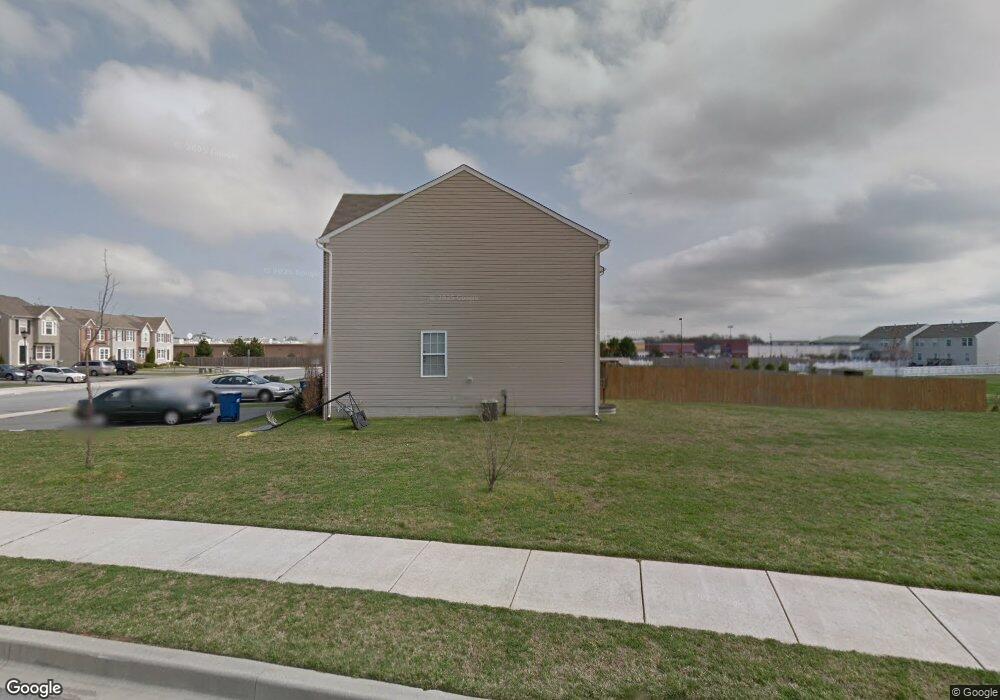
18 Fred Cir Camden, DE 19934
Estimated Value: $270,000 - $314,000
3
Beds
3
Baths
1,250
Sq Ft
$234/Sq Ft
Est. Value
About This Home
This home is located at 18 Fred Cir, Camden, DE 19934 and is currently estimated at $291,911, approximately $233 per square foot. 18 Fred Cir is a home located in Kent County with nearby schools including Nellie Hughes Stokes Elementary School, Fred Fifer Middle School, and Caesar Rodney High School.
Ownership History
Date
Name
Owned For
Owner Type
Purchase Details
Closed on
Oct 28, 2021
Sold by
Frazier Joel and Frazier Mirlande
Bought by
Barlow Chiquishia
Current Estimated Value
Home Financials for this Owner
Home Financials are based on the most recent Mortgage that was taken out on this home.
Original Mortgage
$218,960
Outstanding Balance
$200,104
Interest Rate
2.8%
Mortgage Type
FHA
Estimated Equity
$91,807
Purchase Details
Closed on
Aug 30, 2007
Sold by
Fred Court East Llc
Bought by
Frazier Joel and Frazier Mirlande
Home Financials for this Owner
Home Financials are based on the most recent Mortgage that was taken out on this home.
Original Mortgage
$181,565
Interest Rate
6.74%
Mortgage Type
FHA
Purchase Details
Closed on
Aug 22, 2005
Sold by
Ryland Group Inc
Bought by
Fred Court East Llc
Purchase Details
Closed on
Apr 11, 2005
Sold by
Newells Creek Tnd Llc
Bought by
The Ryland Group Inc
Create a Home Valuation Report for This Property
The Home Valuation Report is an in-depth analysis detailing your home's value as well as a comparison with similar homes in the area
Home Values in the Area
Average Home Value in this Area
Purchase History
| Date | Buyer | Sale Price | Title Company |
|---|---|---|---|
| Barlow Chiquishia | $227,000 | None Available | |
| Frazier Joel | $183,000 | None Available | |
| Fred Court East Llc | $5,017 | None Available | |
| The Ryland Group Inc | -- | None Available |
Source: Public Records
Mortgage History
| Date | Status | Borrower | Loan Amount |
|---|---|---|---|
| Open | Barlow Chiquishia | $218,960 | |
| Previous Owner | Frazier Joel | $181,565 |
Source: Public Records
Tax History
| Year | Tax Paid | Tax Assessment Tax Assessment Total Assessment is a certain percentage of the fair market value that is determined by local assessors to be the total taxable value of land and additions on the property. | Land | Improvement |
|---|---|---|---|---|
| 2025 | $1,003 | $249,800 | $61,000 | $188,800 |
| 2024 | $999 | $249,800 | $61,000 | $188,800 |
| 2023 | $934 | $36,500 | $2,800 | $33,700 |
| 2022 | $883 | $36,500 | $2,800 | $33,700 |
| 2021 | $887 | $36,500 | $2,800 | $33,700 |
| 2020 | $873 | $36,500 | $2,800 | $33,700 |
| 2019 | $839 | $36,500 | $2,800 | $33,700 |
| 2018 | $810 | $36,500 | $2,800 | $33,700 |
| 2017 | $787 | $36,500 | $0 | $0 |
| 2016 | $757 | $35,800 | $0 | $0 |
| 2015 | $636 | $35,800 | $0 | $0 |
| 2014 | $634 | $35,800 | $0 | $0 |
Source: Public Records
Map
Nearby Homes
- 16 Lone Tree Dr
- 99 Jacks Way
- 49 McElvee Ln Unit 123
- 45 Capricorn Way
- 256 Headstart Ln
- 32 Nanticoke Dr
- 109 Wesley St
- 50 Nanticoke Dr
- 24 S Stetson Ln Unit 210
- 11 N Kimmer Ln Unit 265
- 21 E Peach St
- Lot 22 Bee Brookfield Dr
- 12191 Willow Grove Rd
- 15 Wesley St
- 11901 Willow Grove Rd
- 55 Wallace Ln
- 11939 Willow Grove Rd
- 870 Brookfield Dr
- 850 Brookfield Dr
- 74 Nanticoke Dr