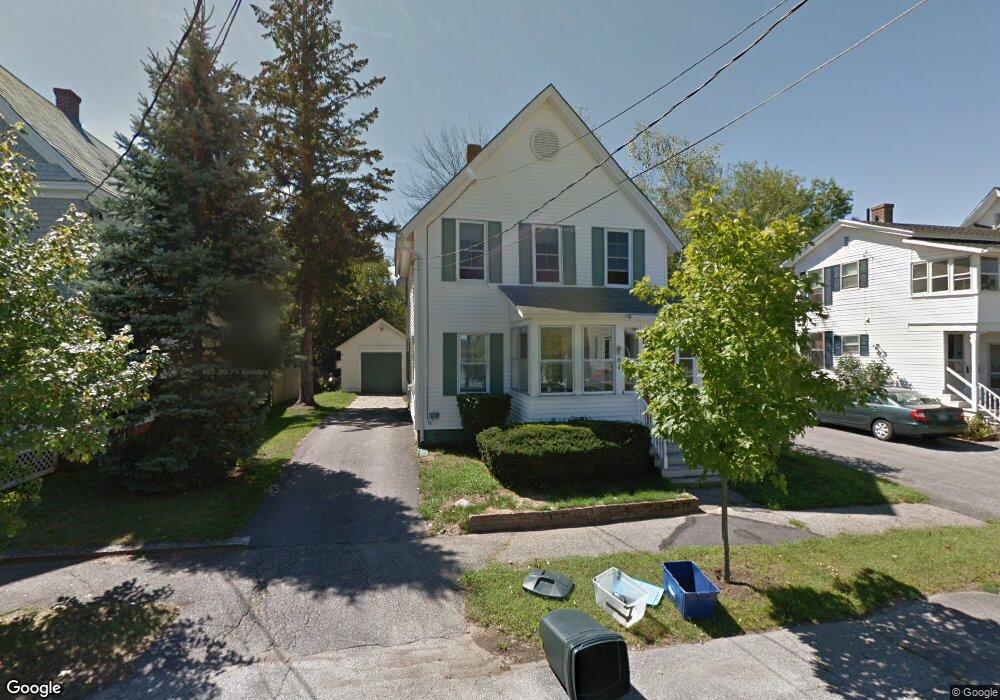
18 Gilmore St Concord, NH 03301
South End NeighborhoodEstimated Value: $421,440 - $457,000
3
Beds
1
Bath
1,242
Sq Ft
$349/Sq Ft
Est. Value
About This Home
This home is located at 18 Gilmore St, Concord, NH 03301 and is currently estimated at $433,360, approximately $348 per square foot. 18 Gilmore St is a home located in Merrimack County with nearby schools including Abbot-Downing School, Rundlett Middle School, and Concord High School.
Ownership History
Date
Name
Owned For
Owner Type
Purchase Details
Closed on
Jun 2, 2025
Sold by
Osiecki Sylvia A and Osiecki Peter
Bought by
Osiecki Ft and Osiecki
Current Estimated Value
Purchase Details
Closed on
Mar 11, 2024
Sold by
Osiecki Sylvia A
Bought by
Osiecki Sylvia A and Osiecki Peter
Purchase Details
Closed on
Dec 11, 1992
Bought by
Sylvia A Osiecki Ret
Create a Home Valuation Report for This Property
The Home Valuation Report is an in-depth analysis detailing your home's value as well as a comparison with similar homes in the area
Home Values in the Area
Average Home Value in this Area
Purchase History
| Date | Buyer | Sale Price | Title Company |
|---|---|---|---|
| Osiecki Ft | -- | None Available | |
| Osiecki Ft | -- | None Available | |
| Osiecki Sylvia A | -- | None Available | |
| Osiecki Sylvia A | -- | None Available | |
| Osiecki Sylvia A | -- | None Available | |
| Osiecki Sylvia A | -- | None Available | |
| Sylvia A Osiecki Ret | $89,500 | -- |
Source: Public Records
Mortgage History
| Date | Status | Borrower | Loan Amount |
|---|---|---|---|
| Previous Owner | Sylvia A Osiecki Ret | $19,000 | |
| Previous Owner | Sylvia A Osiecki Ret | $153,000 | |
| Previous Owner | Sylvia A Osiecki Ret | $22,000 | |
| Previous Owner | Sylvia A Osiecki Ret | $130,000 |
Source: Public Records
Tax History Compared to Growth
Tax History
| Year | Tax Paid | Tax Assessment Tax Assessment Total Assessment is a certain percentage of the fair market value that is determined by local assessors to be the total taxable value of land and additions on the property. | Land | Improvement |
|---|---|---|---|---|
| 2024 | $7,479 | $270,100 | $119,700 | $150,400 |
| 2023 | $7,255 | $270,100 | $119,700 | $150,400 |
| 2022 | $6,993 | $270,100 | $119,700 | $150,400 |
| 2021 | $6,785 | $270,100 | $119,700 | $150,400 |
| 2020 | $6,471 | $241,800 | $94,100 | $147,700 |
| 2019 | $6,187 | $222,700 | $97,800 | $124,900 |
| 2018 | $3,539 | $215,100 | $98,100 | $117,000 |
| 2017 | $5,840 | $206,800 | $98,100 | $108,700 |
| 2016 | $5,556 | $200,800 | $96,300 | $104,500 |
| 2015 | $5,290 | $197,200 | $104,400 | $92,800 |
| 2014 | $5,287 | $197,200 | $104,400 | $92,800 |
| 2013 | -- | $197,200 | $104,400 | $92,800 |
| 2012 | -- | $218,200 | $121,800 | $96,400 |
Source: Public Records
Map
Nearby Homes
- 122 South St
- 12 Avon St
- 0 South St Unit 4969509
- 33 Spruce St
- 0 Spruce St Unit 88
- 105 S Main St
- 24 Badger St
- 15 Wilson Ave
- 22 Wilson Ave
- 47 South St
- 14 Downing St
- 14-16 Perley St
- 10 Perley St
- 376 S Main St
- 87 S Main St Unit 2
- 4 Fayette St
- 54 Pleasant St Unit 8
- 289 South St
- 2 Kensington Rd
- 1 Kensington Rd