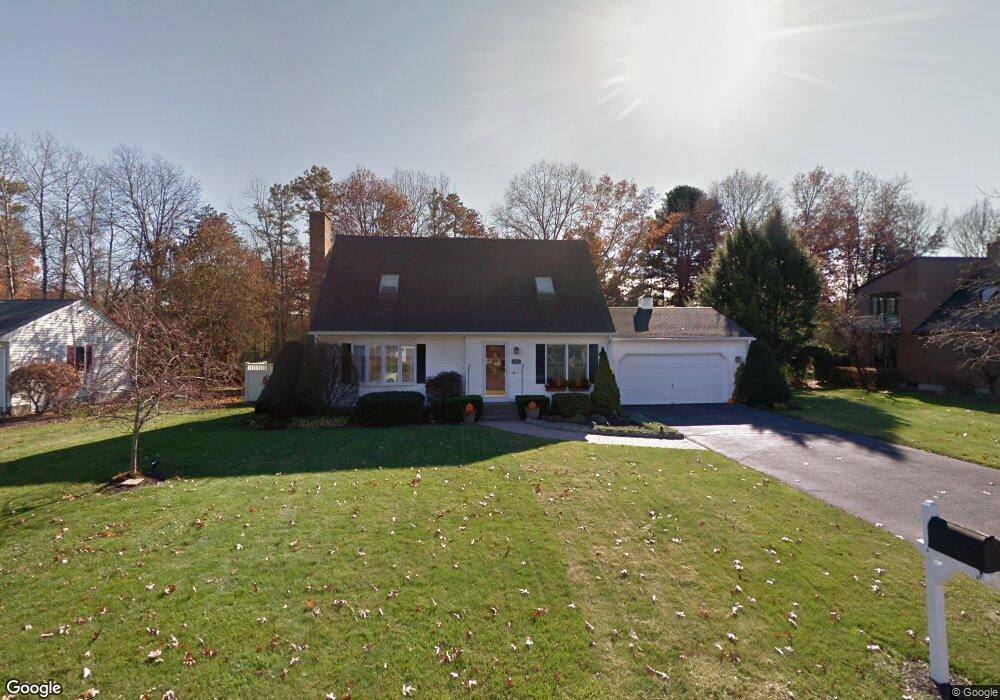
18 Golden Dr Easthampton, MA 01027
Estimated Value: $526,000 - $574,000
3
Beds
2
Baths
1,611
Sq Ft
$339/Sq Ft
Est. Value
About This Home
This home is located at 18 Golden Dr, Easthampton, MA 01027 and is currently estimated at $546,592, approximately $339 per square foot. 18 Golden Dr is a home located in Hampshire County with nearby schools including Easthampton High School, Calvary Baptist Christian School, and Tri-County Schools.
Ownership History
Date
Name
Owned For
Owner Type
Purchase Details
Closed on
Jun 2, 2008
Sold by
Arnaboldi Allan C and Mitchell Sorensen C
Bought by
Parker Teresa A
Current Estimated Value
Home Financials for this Owner
Home Financials are based on the most recent Mortgage that was taken out on this home.
Original Mortgage
$210,000
Interest Rate
5.91%
Mortgage Type
Purchase Money Mortgage
Purchase Details
Closed on
Nov 12, 2004
Sold by
Horne Donna A and Horne William R
Bought by
Sorensen C Mitchell and Arnaboldi Allan C
Home Financials for this Owner
Home Financials are based on the most recent Mortgage that was taken out on this home.
Original Mortgage
$232,000
Interest Rate
5.75%
Mortgage Type
Purchase Money Mortgage
Create a Home Valuation Report for This Property
The Home Valuation Report is an in-depth analysis detailing your home's value as well as a comparison with similar homes in the area
Home Values in the Area
Average Home Value in this Area
Purchase History
| Date | Buyer | Sale Price | Title Company |
|---|---|---|---|
| Parker Teresa A | $309,500 | -- | |
| Sorensen C Mitchell | $290,000 | -- |
Source: Public Records
Mortgage History
| Date | Status | Borrower | Loan Amount |
|---|---|---|---|
| Open | Sorensen C Mitchell | $203,000 | |
| Closed | Sorensen C Mitchell | $54,864 | |
| Closed | Parker Teresa A | $210,000 | |
| Previous Owner | Sorensen C Mitchell | $232,000 | |
| Previous Owner | Sorensen C Mitchell | $43,500 |
Source: Public Records
Tax History Compared to Growth
Tax History
| Year | Tax Paid | Tax Assessment Tax Assessment Total Assessment is a certain percentage of the fair market value that is determined by local assessors to be the total taxable value of land and additions on the property. | Land | Improvement |
|---|---|---|---|---|
| 2025 | $6,790 | $496,700 | $131,600 | $365,100 |
| 2024 | $6,592 | $486,100 | $127,800 | $358,300 |
| 2023 | $4,905 | $334,800 | $100,500 | $234,300 |
| 2022 | $5,534 | $334,800 | $100,500 | $234,300 |
| 2021 | $6,118 | $348,800 | $100,500 | $248,300 |
| 2020 | $5,946 | $334,800 | $100,500 | $234,300 |
| 2019 | $5,015 | $324,400 | $117,200 | $207,200 |
| 2018 | $4,837 | $302,300 | $110,400 | $191,900 |
| 2017 | $4,725 | $291,500 | $106,200 | $185,300 |
| 2016 | $4,579 | $293,700 | $106,200 | $187,500 |
| 2015 | $4,450 | $293,700 | $106,200 | $187,500 |
Source: Public Records
Map
Nearby Homes