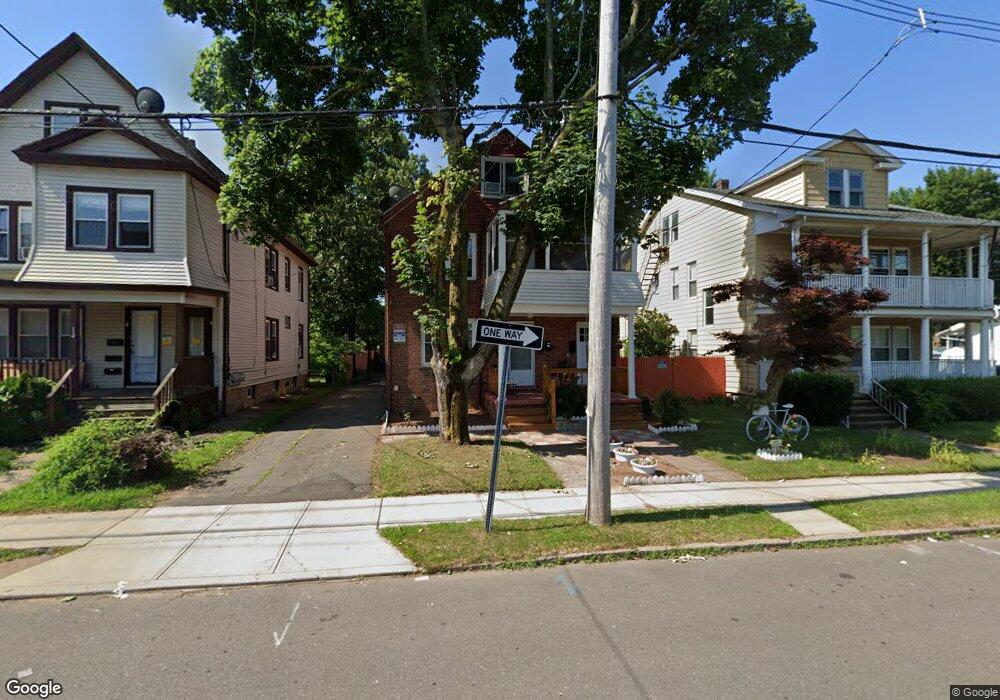
18 Helen St Hamden, CT 06514
Estimated Value: $431,530 - $474,000
4
Beds
2
Baths
2,703
Sq Ft
$170/Sq Ft
Est. Value
About This Home
This home is located at 18 Helen St, Hamden, CT 06514 and is currently estimated at $459,883, approximately $170 per square foot. 18 Helen St is a home located in New Haven County with nearby schools including Hamden Middle School, Hamden High School, and Salma K. Farid Academy.
Ownership History
Date
Name
Owned For
Owner Type
Purchase Details
Closed on
Nov 18, 2005
Sold by
Nutcher Gregory
Bought by
Castillo Jose H
Current Estimated Value
Home Financials for this Owner
Home Financials are based on the most recent Mortgage that was taken out on this home.
Original Mortgage
$274,550
Outstanding Balance
$149,810
Interest Rate
6.07%
Estimated Equity
$310,073
Purchase Details
Closed on
Dec 31, 1996
Sold by
Florio Elaine A
Bought by
Brooks Ronald K and Brooks Highsmith-Brooks D
Home Financials for this Owner
Home Financials are based on the most recent Mortgage that was taken out on this home.
Original Mortgage
$69,450
Interest Rate
7.55%
Mortgage Type
Unknown
Create a Home Valuation Report for This Property
The Home Valuation Report is an in-depth analysis detailing your home's value as well as a comparison with similar homes in the area
Home Values in the Area
Average Home Value in this Area
Purchase History
| Date | Buyer | Sale Price | Title Company |
|---|---|---|---|
| Castillo Jose H | $289,000 | -- | |
| Brooks Ronald K | $83,000 | -- |
Source: Public Records
Mortgage History
| Date | Status | Borrower | Loan Amount |
|---|---|---|---|
| Open | Brooks Ronald K | $274,550 | |
| Previous Owner | Brooks Ronald K | $69,450 |
Source: Public Records
Tax History
| Year | Tax Paid | Tax Assessment Tax Assessment Total Assessment is a certain percentage of the fair market value that is determined by local assessors to be the total taxable value of land and additions on the property. | Land | Improvement |
|---|---|---|---|---|
| 2025 | $14,174 | $273,210 | $43,750 | $229,460 |
| 2024 | $9,381 | $168,700 | $27,860 | $140,840 |
| 2023 | $9,511 | $168,700 | $27,860 | $140,840 |
| 2022 | $9,359 | $168,700 | $27,860 | $140,840 |
| 2021 | $8,847 | $168,700 | $27,860 | $140,840 |
| 2020 | $7,121 | $136,990 | $30,940 | $106,050 |
| 2019 | $6,693 | $136,990 | $30,940 | $106,050 |
| 2018 | $6,570 | $136,990 | $30,940 | $106,050 |
| 2017 | $6,200 | $136,990 | $30,940 | $106,050 |
| 2016 | $6,214 | $136,990 | $30,940 | $106,050 |
| 2015 | $6,208 | $151,900 | $48,720 | $103,180 |
| 2014 | $6,065 | $151,900 | $48,720 | $103,180 |
Source: Public Records
Map
Nearby Homes
Your Personal Tour Guide
Ask me questions while you tour the home.