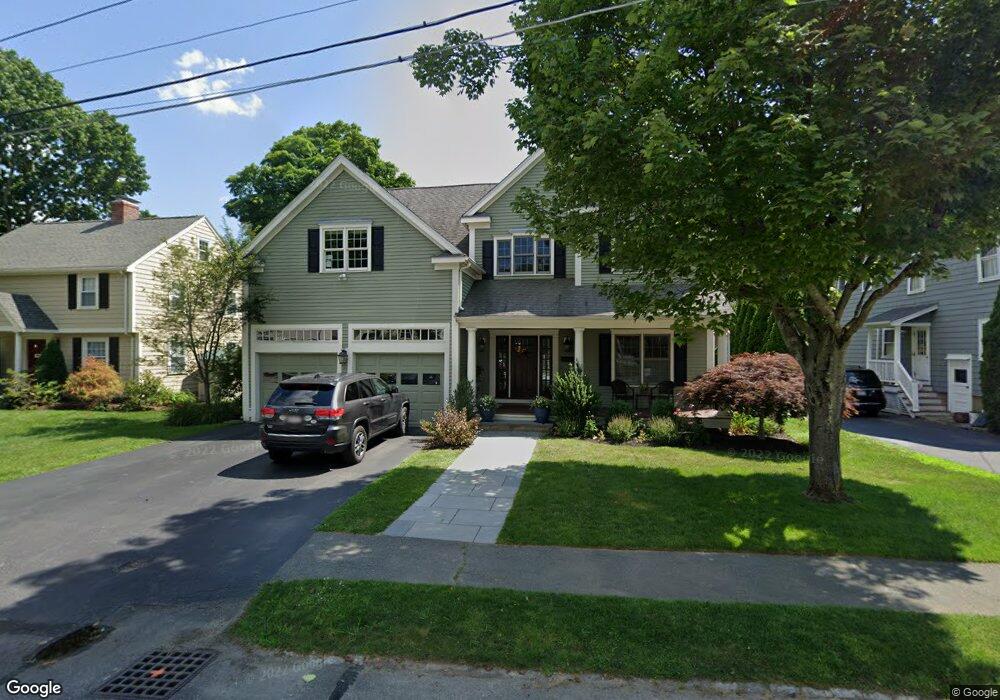
18 Holland St Needham, MA 02492
Estimated Value: $1,457,000 - $2,682,000
4
Beds
3
Baths
1,626
Sq Ft
$1,405/Sq Ft
Est. Value
About This Home
This home is located at 18 Holland St, Needham, MA 02492 and is currently estimated at $2,283,757, approximately $1,404 per square foot. 18 Holland St is a home located in Norfolk County with nearby schools including Mitchell Elementary School, High Rock Middle School, and Pollard Middle School.
Ownership History
Date
Name
Owned For
Owner Type
Purchase Details
Closed on
May 2, 2006
Sold by
Slicklen Builders Inc
Bought by
Mangano Michael J and Mangano Kelly
Current Estimated Value
Purchase Details
Closed on
May 12, 2005
Sold by
Goldberg Jill W and Goldberg Michael J
Bought by
Slicklen Bldrs Inc
Purchase Details
Closed on
Sep 1, 1989
Sold by
Connolly Matthew T
Bought by
Goldberg Michael J
Purchase Details
Closed on
Feb 4, 1988
Sold by
Higgins Extr Donald
Bought by
Connolly Matthew T
Create a Home Valuation Report for This Property
The Home Valuation Report is an in-depth analysis detailing your home's value as well as a comparison with similar homes in the area
Home Values in the Area
Average Home Value in this Area
Purchase History
| Date | Buyer | Sale Price | Title Company |
|---|---|---|---|
| Mangano Michael J | $1,275,000 | -- | |
| Mangano Michael J | $1,275,000 | -- | |
| Slicklen Bldrs Inc | $587,000 | -- | |
| Slicklen Bldrs Inc | $587,000 | -- | |
| Goldberg Michael J | $246,000 | -- | |
| Goldberg Michael J | $246,000 | -- | |
| Connolly Matthew T | $200,000 | -- |
Source: Public Records
Mortgage History
| Date | Status | Borrower | Loan Amount |
|---|---|---|---|
| Open | Connolly Matthew T | $1,090,000 | |
| Closed | Connolly Matthew T | $390,000 |
Source: Public Records
Tax History Compared to Growth
Tax History
| Year | Tax Paid | Tax Assessment Tax Assessment Total Assessment is a certain percentage of the fair market value that is determined by local assessors to be the total taxable value of land and additions on the property. | Land | Improvement |
|---|---|---|---|---|
| 2025 | $23,318 | $2,199,800 | $801,100 | $1,398,700 |
| 2024 | $22,765 | $1,818,300 | $581,800 | $1,236,500 |
| 2023 | $22,288 | $1,709,200 | $581,800 | $1,127,400 |
| 2022 | $21,621 | $1,617,100 | $538,800 | $1,078,300 |
| 2021 | $21,071 | $1,617,100 | $538,800 | $1,078,300 |
| 2020 | $19,998 | $1,601,100 | $538,800 | $1,062,300 |
| 2019 | $19,077 | $1,539,700 | $489,900 | $1,049,800 |
| 2018 | $18,292 | $1,539,700 | $489,900 | $1,049,800 |
| 2017 | $14,772 | $1,242,400 | $489,900 | $752,500 |
| 2016 | $14,427 | $1,250,200 | $489,900 | $760,300 |
| 2015 | $14,115 | $1,250,200 | $489,900 | $760,300 |
| 2014 | $13,353 | $1,147,200 | $426,100 | $721,100 |
Source: Public Records
Map
Nearby Homes
- 40 Otis St Unit L
- 556 Webster St
- 42 Otis St Unit R
- 190 Brookline St
- 62 Washington Ave
- 26 Pinewood Rd
- 154 Warren St
- 332 Hillcrest Rd
- 71 School St
- 445 Hillside Ave
- 233 Warren St
- 3 Crescent Rd
- 1011 Webster St
- 317 Dedham Ave
- 23 Cheney St
- 400 Hunnewell St Unit 103
- 379 Hunnewell St Unit 379
- 34 Pershing Rd
- 9 Jayne Rd
- 143 Hunting Rd
- 14 Holland St
- 24 Holland St
- 666 Webster St
- 666 Webster St
- 4 Holland Terrace
- 15 Holland St
- 668 Webster St
- 674 Webster St
- 674 Webster St Unit 1
- 674 Webster St
- 662 Webster St
- 261 Manning St
- 267 Manning St
- 273 Manning St
- 9 Holland Terrace
- 10 Holland Terrace
- 251 Manning St
- 277 Manning St
- 35 Holland St
- 33 Holland St