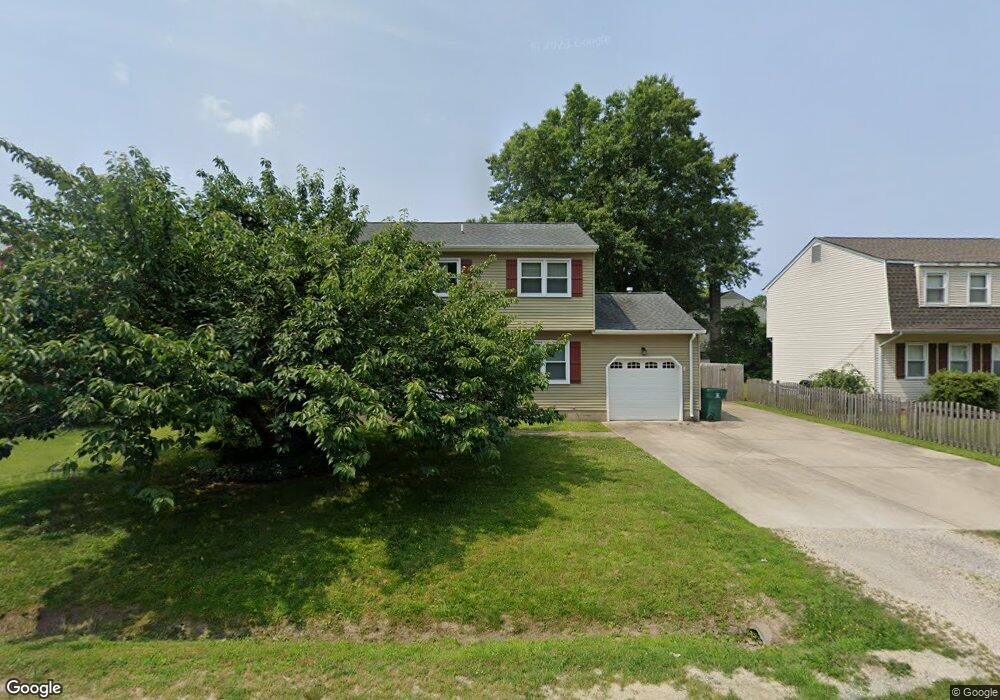
18 Hull St Newport News, VA 23601
Green Oaks NeighborhoodEstimated Value: $308,000 - $341,000
4
Beds
3
Baths
1,645
Sq Ft
$198/Sq Ft
Est. Value
About This Home
This home is located at 18 Hull St, Newport News, VA 23601 and is currently estimated at $325,679, approximately $197 per square foot. 18 Hull St is a home located in Newport News City with nearby schools including Sedgefield Elementary School, Homer L. Hines Middle School, and Warwick High School.
Ownership History
Date
Name
Owned For
Owner Type
Purchase Details
Closed on
Jun 2, 2021
Sold by
Courtney Thomas
Bought by
Courtney Thomas and Tfm Realty
Current Estimated Value
Purchase Details
Closed on
Mar 19, 2021
Sold by
Ottaway Judy G and Judy G Ottaway Living Trust
Bought by
Courtney Thomas Patrick
Home Financials for this Owner
Home Financials are based on the most recent Mortgage that was taken out on this home.
Original Mortgage
$251,465
Outstanding Balance
$225,421
Interest Rate
2.7%
Mortgage Type
New Conventional
Estimated Equity
$100,258
Create a Home Valuation Report for This Property
The Home Valuation Report is an in-depth analysis detailing your home's value as well as a comparison with similar homes in the area
Home Values in the Area
Average Home Value in this Area
Purchase History
| Date | Buyer | Sale Price | Title Company |
|---|---|---|---|
| Courtney Thomas | -- | None Available | |
| Courtney Thomas Patrick | $264,700 | Fidelity National Title |
Source: Public Records
Mortgage History
| Date | Status | Borrower | Loan Amount |
|---|---|---|---|
| Open | Courtney Thomas Patrick | $251,465 |
Source: Public Records
Tax History Compared to Growth
Tax History
| Year | Tax Paid | Tax Assessment Tax Assessment Total Assessment is a certain percentage of the fair market value that is determined by local assessors to be the total taxable value of land and additions on the property. | Land | Improvement |
|---|---|---|---|---|
| 2024 | $3,741 | $317,000 | $60,500 | $256,500 |
| 2023 | $3,613 | $293,700 | $60,500 | $233,200 |
| 2022 | $3,380 | $269,400 | $60,500 | $208,900 |
| 2021 | $2,865 | $234,800 | $55,000 | $179,800 |
| 2020 | $2,433 | $187,400 | $55,000 | $132,400 |
| 2019 | $2,352 | $181,100 | $55,000 | $126,100 |
| 2018 | $2,349 | $181,100 | $55,000 | $126,100 |
| 2017 | $2,349 | $181,100 | $55,000 | $126,100 |
| 2016 | $2,344 | $181,100 | $55,000 | $126,100 |
| 2015 | $2,338 | $181,100 | $55,000 | $126,100 |
| 2014 | $2,082 | $181,100 | $55,000 | $126,100 |
Source: Public Records
Map
Nearby Homes