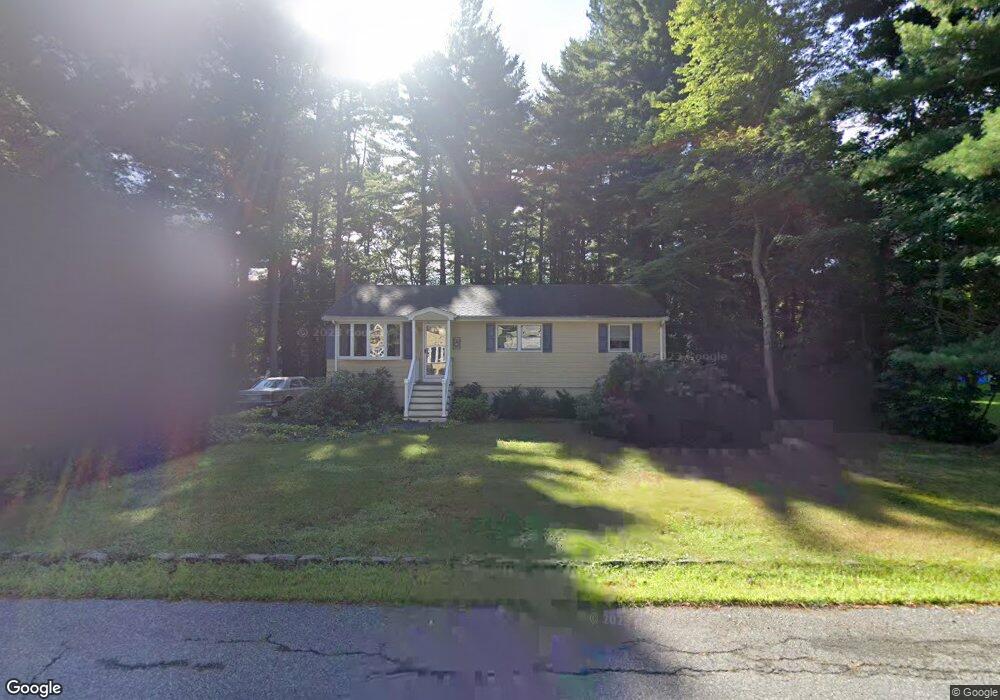
18 Jacquith Rd Wilmington, MA 01887
Estimated Value: $623,000 - $700,000
3
Beds
1
Bath
1,008
Sq Ft
$652/Sq Ft
Est. Value
About This Home
This home is located at 18 Jacquith Rd, Wilmington, MA 01887 and is currently estimated at $656,757, approximately $651 per square foot. 18 Jacquith Rd is a home located in Middlesex County with nearby schools including Wilmington Middle School, Wilmington High School, and Abundant Life Christian School and Childcare.
Ownership History
Date
Name
Owned For
Owner Type
Purchase Details
Closed on
Mar 20, 2024
Sold by
Odonnell James H and Odonnell Christine E
Bought by
James H Odonnell Lt and Odonnell
Current Estimated Value
Purchase Details
Closed on
Jun 21, 2010
Sold by
Canal Village Llc
Bought by
Peluso Allen and Keane Rachelle
Home Financials for this Owner
Home Financials are based on the most recent Mortgage that was taken out on this home.
Original Mortgage
$401,755
Interest Rate
5.03%
Mortgage Type
Purchase Money Mortgage
Create a Home Valuation Report for This Property
The Home Valuation Report is an in-depth analysis detailing your home's value as well as a comparison with similar homes in the area
Purchase History
| Date | Buyer | Sale Price | Title Company |
|---|---|---|---|
| James H Odonnell Lt | -- | None Available | |
| Odonnell James H | -- | None Available | |
| Peluso Allen | $422,900 | -- |
Source: Public Records
Mortgage History
| Date | Status | Borrower | Loan Amount |
|---|---|---|---|
| Previous Owner | Peluso Allen | $401,755 |
Source: Public Records
Tax History
| Year | Tax Paid | Tax Assessment Tax Assessment Total Assessment is a certain percentage of the fair market value that is determined by local assessors to be the total taxable value of land and additions on the property. | Land | Improvement |
|---|---|---|---|---|
| 2025 | $6,275 | $548,000 | $306,300 | $241,700 |
| 2024 | $6,229 | $545,000 | $306,300 | $238,700 |
| 2023 | $6,033 | $505,300 | $278,500 | $226,800 |
| 2022 | $5,712 | $438,400 | $232,000 | $206,400 |
| 2021 | $5,702 | $412,000 | $210,900 | $201,100 |
| 2020 | $5,428 | $399,700 | $210,900 | $188,800 |
| 2019 | $5,358 | $389,700 | $200,700 | $189,000 |
| 2018 | $5,009 | $347,600 | $191,300 | $156,300 |
| 2017 | $4,858 | $336,200 | $191,300 | $144,900 |
| 2016 | $4,654 | $318,100 | $182,200 | $135,900 |
| 2015 | $4,407 | $306,700 | $182,200 | $124,500 |
| 2014 | $4,279 | $300,500 | $173,600 | $126,900 |
Source: Public Records
Map
Nearby Homes
- 56 Grove Ave
- 114 Lake St
- 3 Sarafina's Way
- 3 Clark Terrace
- 17 Lake St
- 35 Oak St
- 31 Burlington Ave
- 50 Glenwood Rd
- 44 Connolly Rd
- 95 Bellflower Rd
- 6 Glade St
- 12 Hamlin Ln
- 25 Greenhalge St
- 9 Parker St
- 3 Shawnee Cir
- 15 Primrose Rd
- 7 Cross St Unit 102
- 7 Cross St Unit 303
- 7 Cross St Unit 304
- 7 Cross St Unit 205