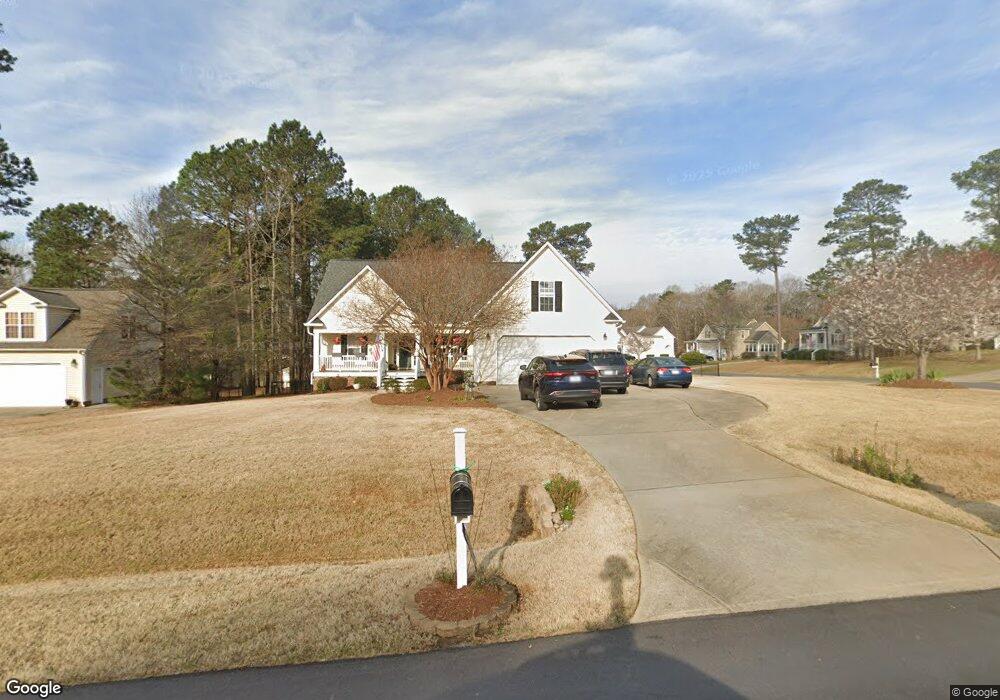
18 Javelin Ct Clayton, NC 27520
Estimated Value: $379,941 - $389,000
3
Beds
2
Baths
1,928
Sq Ft
$199/Sq Ft
Est. Value
About This Home
This home is located at 18 Javelin Ct, Clayton, NC 27520 and is currently estimated at $383,235, approximately $198 per square foot. 18 Javelin Ct is a home located in Johnston County with nearby schools including Polenta Elementary School, Swift Creek Middle, and Cleveland High School.
Ownership History
Date
Name
Owned For
Owner Type
Purchase Details
Closed on
Nov 3, 2023
Sold by
Monville Louis G and Monville Marlin L
Bought by
Monville Family Trust and Monville
Current Estimated Value
Purchase Details
Closed on
Jan 21, 2021
Sold by
Vonjohnson Lee Von and Johnson Amy Godwin
Bought by
Monville Louis G and Monville Marlin
Home Financials for this Owner
Home Financials are based on the most recent Mortgage that was taken out on this home.
Original Mortgage
$261,250
Interest Rate
2.67%
Mortgage Type
New Conventional
Purchase Details
Closed on
Apr 23, 2007
Sold by
Carroll Construction Homes Inc
Bought by
Vonvonbenson Lee Von and Benson Amy Godwin
Home Financials for this Owner
Home Financials are based on the most recent Mortgage that was taken out on this home.
Original Mortgage
$194,650
Interest Rate
6.12%
Mortgage Type
Purchase Money Mortgage
Create a Home Valuation Report for This Property
The Home Valuation Report is an in-depth analysis detailing your home's value as well as a comparison with similar homes in the area
Home Values in the Area
Average Home Value in this Area
Purchase History
| Date | Buyer | Sale Price | Title Company |
|---|---|---|---|
| Monville Family Trust | -- | None Listed On Document | |
| Monville Louis G | $275,000 | None Available | |
| Vonvonbenson Lee Von | $195,000 | None Available |
Source: Public Records
Mortgage History
| Date | Status | Borrower | Loan Amount |
|---|---|---|---|
| Previous Owner | Monville Louis G | $261,250 | |
| Previous Owner | Vonvonbenson Lee Von | $194,650 |
Source: Public Records
Tax History Compared to Growth
Tax History
| Year | Tax Paid | Tax Assessment Tax Assessment Total Assessment is a certain percentage of the fair market value that is determined by local assessors to be the total taxable value of land and additions on the property. | Land | Improvement |
|---|---|---|---|---|
| 2025 | $2,291 | $360,710 | $80,000 | $280,710 |
| 2024 | $1,882 | $232,290 | $42,000 | $190,290 |
| 2023 | $1,789 | $232,290 | $42,000 | $190,290 |
| 2022 | $1,835 | $232,290 | $42,000 | $190,290 |
| 2021 | $1,684 | $213,150 | $42,000 | $171,150 |
| 2020 | $1,814 | $213,150 | $42,000 | $171,150 |
| 2019 | $1,838 | $213,150 | $42,000 | $171,150 |
| 2018 | $1,684 | $189,360 | $33,000 | $156,360 |
| 2017 | $1,654 | $185,520 | $33,000 | $152,520 |
| 2016 | $1,582 | $185,520 | $33,000 | $152,520 |
| 2015 | $1,582 | $185,520 | $33,000 | $152,520 |
| 2014 | $1,582 | $185,520 | $33,000 | $152,520 |
Source: Public Records
Map
Nearby Homes
- 109 Fountain Dr
- 346 Silver Creek Dr
- 60 Branding Iron Dr
- 75 Santa Gertrudis Dr
- 391 Crystal Creek Dr
- 433 Steel Bridge Rd
- 386 Rising Star Dr
- 196 Cozy Brook Ct
- 52 Quail Point Cir
- 79 Quail Point Cir
- 76 Cozy Brook Ct
- Colfax Plan at High Springs
- Cooper Plan at High Springs
- Raleigh Plan at High Springs
- Davidson Plan at High Springs
- Cypress Plan at High Springs
- Wescott Plan at High Springs
- Asheboro Plan at High Springs
- McDowell Plan at High Springs
- 380 Cooper Branch Rd
- 44 Javelin Ct
- 594 Contender Dr
- 663 Contender Dr
- 72 Javelin Ct
- 643 Contender Dr
- 679 Contender Dr
- 712 Contender Dr
- 55 Javelin Ct
- 617 Contender Dr
- 37 Javelin Ct
- 701 Contender Dr
- 603 Contender Dr
- 552 Contender Dr
- 104 Javelin Ct
- 589 Contender Dr
- 723 Contender Dr
- 73 Javelin Ct
- 575 Contender Dr
- 526 Contender Dr
- 561 Contender Dr