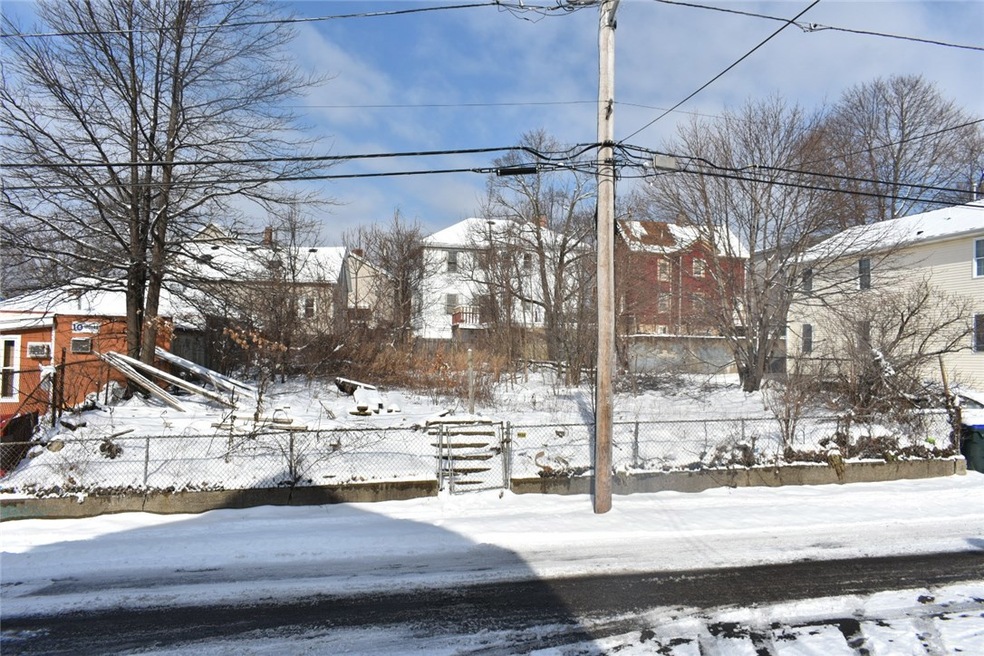
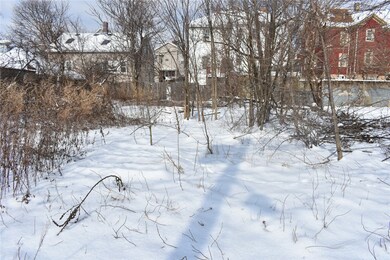
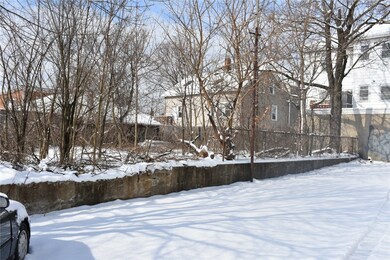
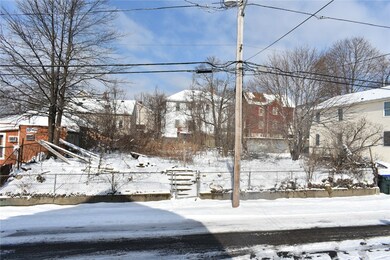
18 Julian St Providence, RI 02909
Olneyville NeighborhoodHighlights
- Recreation Facilities
- Shops
- Level Lot
- Public Transportation
- Fenced
- 1-minute walk to Joslin Park & Playground
About This Lot
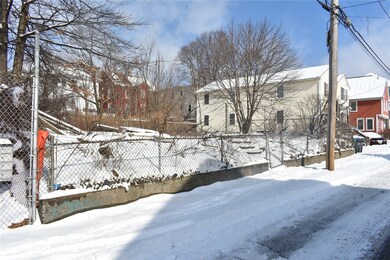
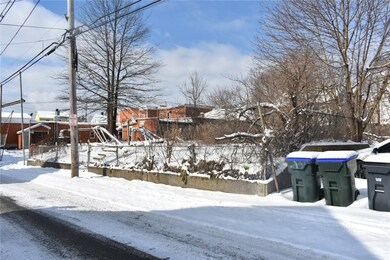
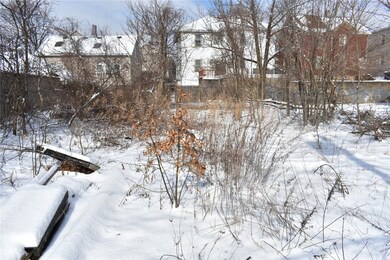
As of May 2021Attention Builders and Contractors!! Opportunity knocks !! Available for sale Residential Lot of approximately 5,400sf. (Best use for Multi-family or Single family build). Close to: Shopping, restaurants, recreational park at walking distance, minutes to RT-6/10, I-95 & Downtown, public transportation.
Last Buyer's Agent
Anytime Team
Anytime Realty
Property Details
Property Type
- Land
Est. Annual Taxes
- $472
Year Built
- 2020
Lot Details
- 5,413 Sq Ft Lot
- Fenced
- Level Lot
- Finished Lot(s)
Utilities
- Underground Utilities
Listing and Financial Details
- Tax Lot 495
- Assessor Parcel Number 18JULIANSTPROV
Community Details
Overview
- Olneyville Subdivision
Amenities
- Shops
- Public Transportation
Recreation
- Recreation Facilities
Ownership History
Purchase Details
Home Financials for this Owner
Home Financials are based on the most recent Mortgage that was taken out on this home.Purchase Details
Home Financials for this Owner
Home Financials are based on the most recent Mortgage that was taken out on this home.Purchase Details
Home Financials for this Owner
Home Financials are based on the most recent Mortgage that was taken out on this home.Purchase Details
Home Financials for this Owner
Home Financials are based on the most recent Mortgage that was taken out on this home.Purchase Details
Map
Home Values in the Area
Average Home Value in this Area
Purchase History
| Date | Type | Sale Price | Title Company |
|---|---|---|---|
| Warranty Deed | $385,000 | None Available | |
| Warranty Deed | $58,000 | None Available | |
| Warranty Deed | $44,000 | -- | |
| Warranty Deed | $17,000 | -- | |
| Deed | -- | -- |
Mortgage History
| Date | Status | Loan Amount | Loan Type |
|---|---|---|---|
| Open | $378,026 | FHA | |
| Previous Owner | $252,500 | Commercial |
Property History
| Date | Event | Price | Change | Sq Ft Price |
|---|---|---|---|---|
| 05/28/2021 05/28/21 | Sold | $385,000 | 0.0% | $148 / Sq Ft |
| 04/28/2021 04/28/21 | Pending | -- | -- | -- |
| 12/10/2020 12/10/20 | For Sale | $384,900 | +563.6% | $148 / Sq Ft |
| 07/20/2020 07/20/20 | Sold | $58,000 | -17.0% | $22 / Sq Ft |
| 06/20/2020 06/20/20 | Pending | -- | -- | -- |
| 04/25/2020 04/25/20 | For Sale | $69,900 | +58.9% | $27 / Sq Ft |
| 05/01/2019 05/01/19 | Sold | $44,000 | -26.5% | $17 / Sq Ft |
| 04/01/2019 04/01/19 | Pending | -- | -- | -- |
| 03/07/2019 03/07/19 | For Sale | $59,900 | +252.4% | $23 / Sq Ft |
| 01/14/2013 01/14/13 | Sold | $17,000 | -15.0% | $7 / Sq Ft |
| 12/15/2012 12/15/12 | Pending | -- | -- | -- |
| 11/13/2012 11/13/12 | For Sale | $20,000 | -- | $8 / Sq Ft |
Tax History
| Year | Tax Paid | Tax Assessment Tax Assessment Total Assessment is a certain percentage of the fair market value that is determined by local assessors to be the total taxable value of land and additions on the property. | Land | Improvement |
|---|---|---|---|---|
| 2024 | $7,993 | $435,600 | $73,300 | $362,300 |
| 2023 | $7,993 | $435,600 | $73,300 | $362,300 |
| 2022 | $7,754 | $435,600 | $73,300 | $362,300 |
| 2021 | $6,034 | $245,700 | $35,800 | $209,900 |
| 2020 | $440 | $17,900 | $17,900 | $0 |
| 2019 | $440 | $17,900 | $17,900 | $0 |
| 2018 | $473 | $14,800 | $14,800 | $0 |
| 2017 | $473 | $14,800 | $14,800 | $0 |
| 2016 | $473 | $14,800 | $14,800 | $0 |
| 2015 | $586 | $17,700 | $17,700 | $0 |
| 2014 | $597 | $17,700 | $17,700 | $0 |
| 2013 | $597 | $17,700 | $17,700 | $0 |
Source: State-Wide MLS
MLS Number: 1216169
APN: PROV-620495-000000-000000
