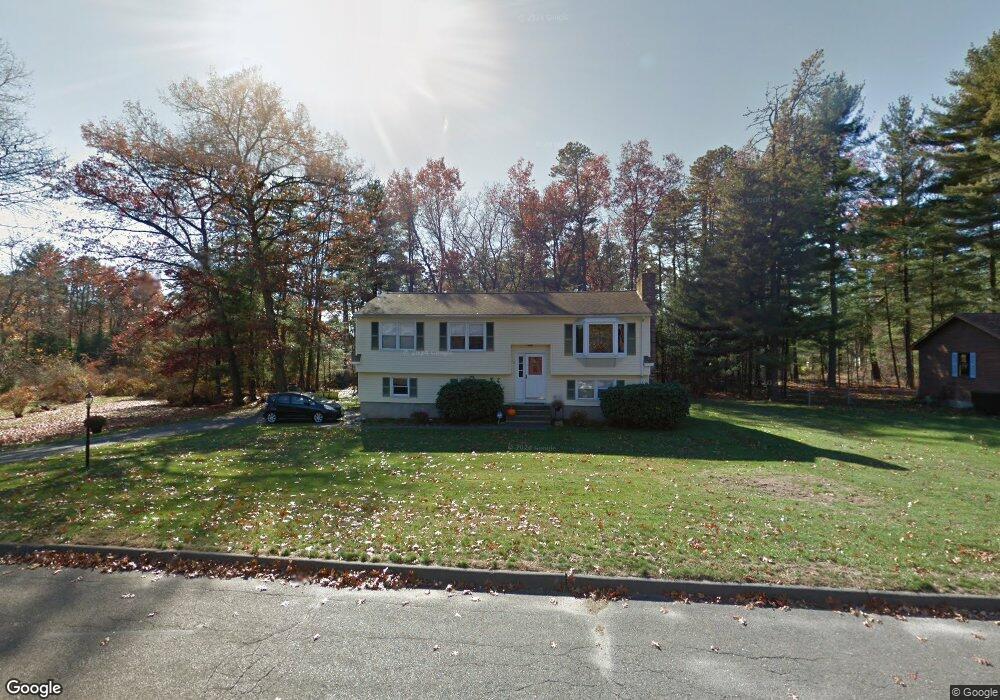
18 Kania St Easthampton, MA 01027
Estimated Value: $397,000 - $440,572
3
Beds
1
Bath
1,400
Sq Ft
$297/Sq Ft
Est. Value
About This Home
This home is located at 18 Kania St, Easthampton, MA 01027 and is currently estimated at $415,643, approximately $296 per square foot. 18 Kania St is a home located in Hampshire County with nearby schools including Easthampton High School, Hilltown Cooperative Charter Public School, and Calvary Baptist Christian School.
Ownership History
Date
Name
Owned For
Owner Type
Purchase Details
Closed on
Apr 8, 1997
Sold by
Canon Robeert A
Bought by
Rood Lisa M and Rood Timothy E
Current Estimated Value
Purchase Details
Closed on
Dec 13, 1996
Sold by
Masaitis Gary A and Masaitis Kathleen A
Bought by
Canon Robert A
Create a Home Valuation Report for This Property
The Home Valuation Report is an in-depth analysis detailing your home's value as well as a comparison with similar homes in the area
Home Values in the Area
Average Home Value in this Area
Purchase History
| Date | Buyer | Sale Price | Title Company |
|---|---|---|---|
| Rood Lisa M | $116,000 | -- | |
| Canon Robert A | $114,600 | -- |
Source: Public Records
Mortgage History
| Date | Status | Borrower | Loan Amount |
|---|---|---|---|
| Open | Canon Robert A | $147,750 | |
| Closed | Canon Robert A | $160,000 |
Source: Public Records
Tax History
| Year | Tax Paid | Tax Assessment Tax Assessment Total Assessment is a certain percentage of the fair market value that is determined by local assessors to be the total taxable value of land and additions on the property. | Land | Improvement |
|---|---|---|---|---|
| 2025 | $4,174 | $0 | $0 | $0 |
| 2024 | $4,174 | $307,800 | $116,700 | $191,100 |
| 2023 | $3,432 | $234,300 | $91,700 | $142,600 |
| 2022 | $3,873 | $234,300 | $91,700 | $142,600 |
| 2021 | $4,411 | $241,800 | $91,700 | $150,100 |
| 2020 | $4,161 | $234,300 | $91,700 | $142,600 |
| 2019 | $3,622 | $234,300 | $91,700 | $142,600 |
| 2018 | $3,470 | $216,900 | $86,400 | $130,500 |
| 2017 | $3,390 | $209,100 | $83,100 | $126,000 |
| 2016 | $3,260 | $209,100 | $83,100 | $126,000 |
| 2015 | $3,168 | $209,100 | $83,100 | $126,000 |
Source: Public Records
Map
Nearby Homes
Your Personal Tour Guide
Ask me questions while you tour the home.