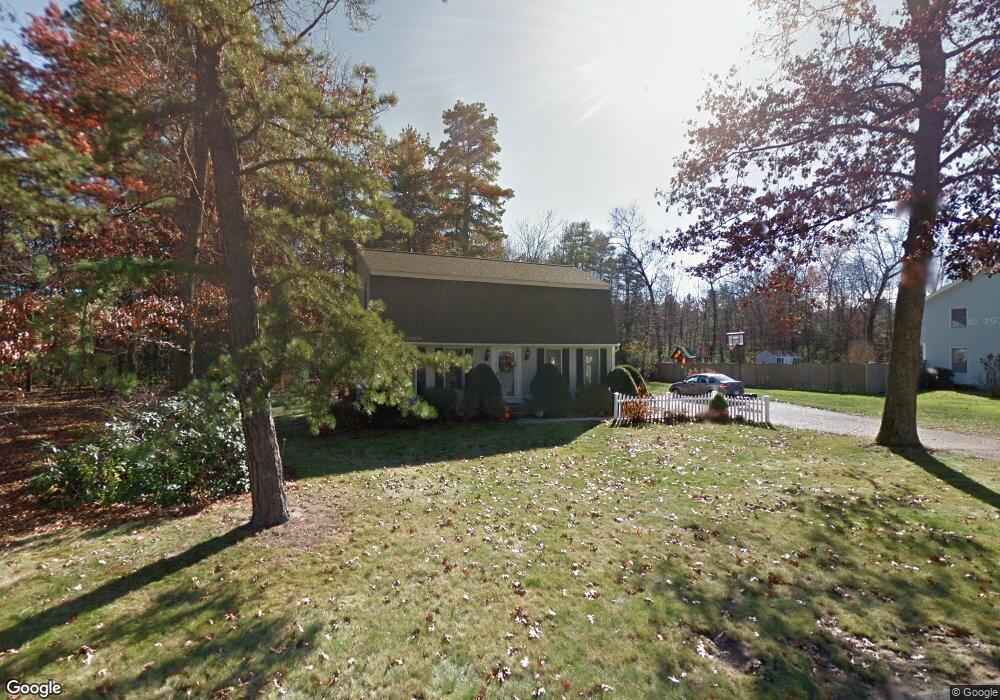
18 Kimberly Ln Easthampton, MA 01027
Estimated Value: $476,000 - $519,000
3
Beds
2
Baths
1,728
Sq Ft
$287/Sq Ft
Est. Value
About This Home
This home is located at 18 Kimberly Ln, Easthampton, MA 01027 and is currently estimated at $496,504, approximately $287 per square foot. 18 Kimberly Ln is a home located in Hampshire County with nearby schools including Easthampton High School, Calvary Baptist Christian School, and Tri-County Schools.
Ownership History
Date
Name
Owned For
Owner Type
Purchase Details
Closed on
Aug 8, 2008
Sold by
Scanlon Edward J
Bought by
Scanlon Nancy M
Current Estimated Value
Purchase Details
Closed on
Nov 4, 2004
Sold by
Meisner John R and Meisner Patricia A
Bought by
Scanlon Edward J and Scanlon Nancy M
Home Financials for this Owner
Home Financials are based on the most recent Mortgage that was taken out on this home.
Original Mortgage
$400,000
Interest Rate
5.71%
Mortgage Type
Purchase Money Mortgage
Create a Home Valuation Report for This Property
The Home Valuation Report is an in-depth analysis detailing your home's value as well as a comparison with similar homes in the area
Home Values in the Area
Average Home Value in this Area
Purchase History
| Date | Buyer | Sale Price | Title Company |
|---|---|---|---|
| Scanlon Nancy M | -- | -- | |
| Scanlon Edward J | $220,000 | -- |
Source: Public Records
Mortgage History
| Date | Status | Borrower | Loan Amount |
|---|---|---|---|
| Previous Owner | Scanlon Edward J | $400,000 | |
| Previous Owner | Scanlon Edward J | $112,800 | |
| Previous Owner | Scanlon Edward J | $70,000 | |
| Previous Owner | Scanlon Edward J | $25,000 |
Source: Public Records
Tax History Compared to Growth
Tax History
| Year | Tax Paid | Tax Assessment Tax Assessment Total Assessment is a certain percentage of the fair market value that is determined by local assessors to be the total taxable value of land and additions on the property. | Land | Improvement |
|---|---|---|---|---|
| 2025 | $5,560 | $406,700 | $122,800 | $283,900 |
| 2024 | $5,360 | $395,300 | $119,200 | $276,100 |
| 2023 | $4,039 | $275,700 | $94,400 | $181,300 |
| 2022 | $4,557 | $275,700 | $94,400 | $181,300 |
| 2021 | $5,009 | $285,600 | $94,400 | $191,200 |
| 2020 | $4,896 | $275,700 | $94,400 | $181,300 |
| 2019 | $4,140 | $267,800 | $94,400 | $173,400 |
| 2018 | $3,987 | $249,200 | $89,300 | $159,900 |
| 2017 | $3,886 | $239,700 | $85,600 | $154,100 |
| 2016 | $3,874 | $248,500 | $85,600 | $162,900 |
| 2015 | $3,765 | $248,500 | $85,600 | $162,900 |
Source: Public Records
Map
Nearby Homes