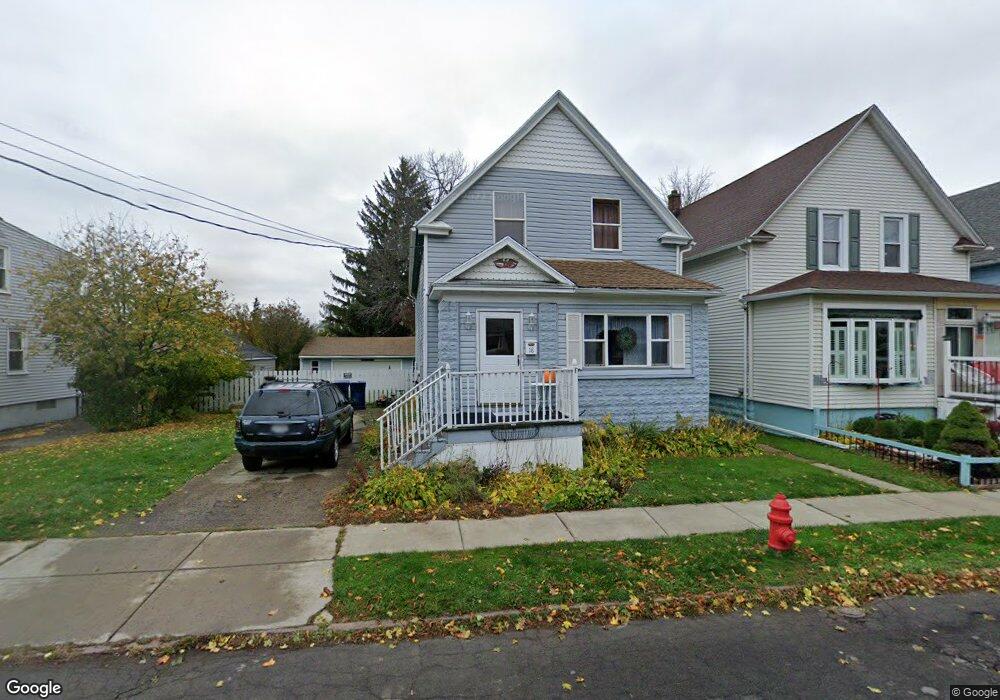
18 Knoerl Ave Buffalo, NY 14210
Cazenovia Park NeighborhoodEstimated Value: $227,092 - $244,000
4
Beds
2
Baths
1,704
Sq Ft
$137/Sq Ft
Est. Value
About This Home
This home is located at 18 Knoerl Ave, Buffalo, NY 14210 and is currently estimated at $234,273, approximately $137 per square foot. 18 Knoerl Ave is a home located in Erie County with nearby schools including South Buffalo Charter School and Bishop Timon-St. Jude High School.
Ownership History
Date
Name
Owned For
Owner Type
Purchase Details
Closed on
Mar 24, 2008
Sold by
Navy Fcu
Bought by
Bauer Thomas J and Bauer June S
Current Estimated Value
Home Financials for this Owner
Home Financials are based on the most recent Mortgage that was taken out on this home.
Original Mortgage
$10,000
Outstanding Balance
$6,237
Interest Rate
5.76%
Mortgage Type
Purchase Money Mortgage
Estimated Equity
$228,036
Purchase Details
Closed on
Dec 6, 2007
Sold by
Trough John P and Trough John Peter
Bought by
Navy Fcu
Purchase Details
Closed on
Mar 29, 2005
Sold by
Homecomings Financial
Bought by
Trough John Peter
Create a Home Valuation Report for This Property
The Home Valuation Report is an in-depth analysis detailing your home's value as well as a comparison with similar homes in the area
Home Values in the Area
Average Home Value in this Area
Purchase History
| Date | Buyer | Sale Price | Title Company |
|---|---|---|---|
| Bauer Thomas J | $12,500 | None Available | |
| Navy Fcu | $51,000 | None Available | |
| Trough John Peter | $16,900 | -- |
Source: Public Records
Mortgage History
| Date | Status | Borrower | Loan Amount |
|---|---|---|---|
| Open | Bauer Thomas J | $10,000 |
Source: Public Records
Tax History Compared to Growth
Tax History
| Year | Tax Paid | Tax Assessment Tax Assessment Total Assessment is a certain percentage of the fair market value that is determined by local assessors to be the total taxable value of land and additions on the property. | Land | Improvement |
|---|---|---|---|---|
| 2024 | $471 | $84,000 | $8,600 | $75,400 |
| 2023 | $426 | $84,000 | $8,600 | $75,400 |
| 2022 | $422 | $84,000 | $8,600 | $75,400 |
| 2021 | $422 | $84,000 | $8,600 | $75,400 |
| 2020 | $470 | $84,000 | $8,600 | $75,400 |
| 2019 | $1,674 | $61,000 | $7,700 | $53,300 |
| 2018 | $1,575 | $61,000 | $7,700 | $53,300 |
| 2017 | $363 | $61,000 | $7,700 | $53,300 |
| 2016 | $1,168 | $61,000 | $7,700 | $53,300 |
| 2015 | -- | $61,000 | $7,700 | $53,300 |
| 2014 | -- | $61,000 | $7,700 | $53,300 |
Source: Public Records
Map
Nearby Homes