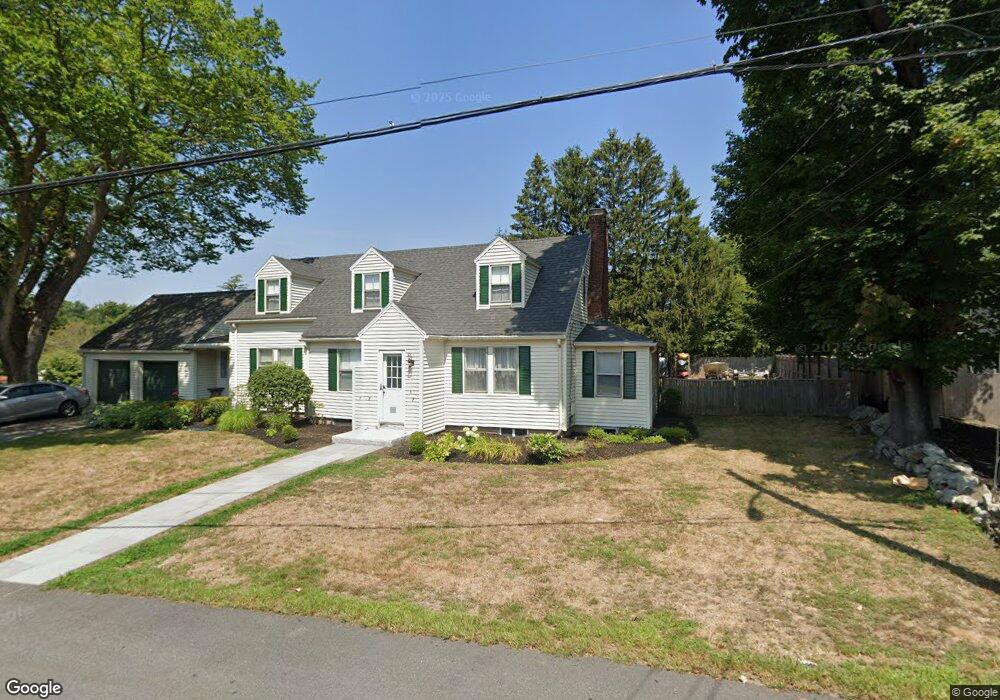
18 Lake Ave Wenham, MA 01984
Estimated Value: $505,000 - $910,242
4
Beds
3
Baths
1,796
Sq Ft
$423/Sq Ft
Est. Value
About This Home
This home is located at 18 Lake Ave, Wenham, MA 01984 and is currently estimated at $759,414, approximately $422 per square foot. 18 Lake Ave is a home located in Essex County with nearby schools including Winthrop School, Bessie Buker Elementary School, and Cutler Elementary School.
Ownership History
Date
Name
Owned For
Owner Type
Purchase Details
Closed on
Nov 19, 1993
Sold by
Lawrence Jay and Lawrence Cheryl
Bought by
Mehlman Henry and Mehlman Anita
Current Estimated Value
Home Financials for this Owner
Home Financials are based on the most recent Mortgage that was taken out on this home.
Original Mortgage
$877,500
Interest Rate
6.77%
Mortgage Type
Purchase Money Mortgage
Purchase Details
Closed on
Mar 17, 1989
Sold by
Travis Jean B
Bought by
Stephenson 3 P Tapley
Create a Home Valuation Report for This Property
The Home Valuation Report is an in-depth analysis detailing your home's value as well as a comparison with similar homes in the area
Home Values in the Area
Average Home Value in this Area
Purchase History
| Date | Buyer | Sale Price | Title Company |
|---|---|---|---|
| Mehlman Henry | $1,170,000 | -- | |
| Stephenson 3 P Tapley | $190,000 | -- |
Source: Public Records
Mortgage History
| Date | Status | Borrower | Loan Amount |
|---|---|---|---|
| Open | Stephenson 3 P Tapley | $95,000 | |
| Closed | Stephenson 3 P Tapley | $877,500 | |
| Previous Owner | Stephenson 3 P Tapley | $150,000 | |
| Previous Owner | Stephenson 3 P Tapley | $150,000 |
Source: Public Records
Tax History Compared to Growth
Tax History
| Year | Tax Paid | Tax Assessment Tax Assessment Total Assessment is a certain percentage of the fair market value that is determined by local assessors to be the total taxable value of land and additions on the property. | Land | Improvement |
|---|---|---|---|---|
| 2025 | $12,409 | $798,500 | $486,500 | $312,000 |
| 2024 | $12,243 | $781,800 | $486,500 | $295,300 |
| 2023 | $12,168 | $701,300 | $478,500 | $222,800 |
| 2022 | $10,464 | $534,400 | $328,100 | $206,300 |
| 2021 | $10,037 | $510,000 | $303,700 | $206,300 |
| 2020 | $8,870 | $468,300 | $303,300 | $165,000 |
| 2019 | $8,439 | $468,300 | $303,300 | $165,000 |
| 2018 | $8,021 | $426,900 | $293,500 | $133,400 |
| 2017 | $7,825 | $426,900 | $293,500 | $133,400 |
| 2016 | $7,249 | $426,900 | $293,500 | $133,400 |
| 2015 | $8,535 | $525,200 | $333,500 | $191,700 |
Source: Public Records
Map
Nearby Homes