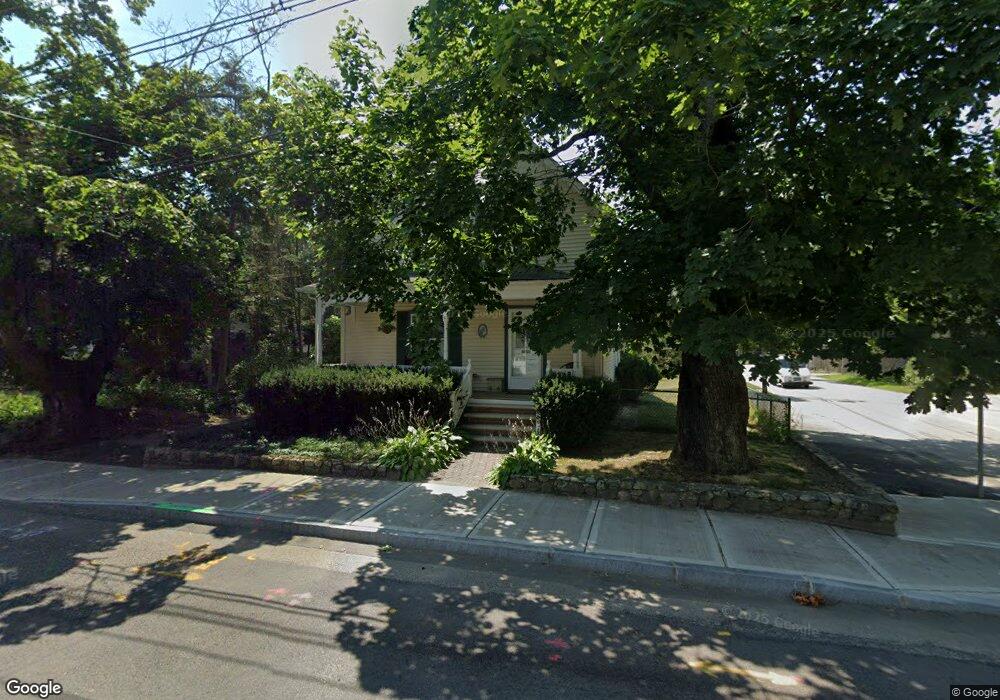
18 Lamb St Attleboro, MA 02703
Estimated Value: $431,000 - $485,886
4
Beds
2
Baths
1,663
Sq Ft
$280/Sq Ft
Est. Value
About This Home
This home is located at 18 Lamb St, Attleboro, MA 02703 and is currently estimated at $466,222, approximately $280 per square foot. 18 Lamb St is a home located in Bristol County with nearby schools including Peter Thacher Elementary School, Cyril K. Brennan Middle School, and Attleboro High School.
Ownership History
Date
Name
Owned For
Owner Type
Purchase Details
Closed on
Aug 19, 1988
Sold by
Munoz Ana
Bought by
Jones Wm F
Current Estimated Value
Home Financials for this Owner
Home Financials are based on the most recent Mortgage that was taken out on this home.
Original Mortgage
$120,000
Interest Rate
10.32%
Mortgage Type
Purchase Money Mortgage
Create a Home Valuation Report for This Property
The Home Valuation Report is an in-depth analysis detailing your home's value as well as a comparison with similar homes in the area
Home Values in the Area
Average Home Value in this Area
Purchase History
| Date | Buyer | Sale Price | Title Company |
|---|---|---|---|
| Jones Wm F | $150,000 | -- |
Source: Public Records
Mortgage History
| Date | Status | Borrower | Loan Amount |
|---|---|---|---|
| Closed | Jones Wm F | $117,000 | |
| Closed | Jones Wm F | $120,000 |
Source: Public Records
Tax History Compared to Growth
Tax History
| Year | Tax Paid | Tax Assessment Tax Assessment Total Assessment is a certain percentage of the fair market value that is determined by local assessors to be the total taxable value of land and additions on the property. | Land | Improvement |
|---|---|---|---|---|
| 2025 | $4,611 | $367,400 | $120,600 | $246,800 |
| 2024 | $4,618 | $362,800 | $120,600 | $242,200 |
| 2023 | $4,444 | $324,600 | $109,600 | $215,000 |
| 2022 | $4,303 | $297,800 | $104,300 | $193,500 |
| 2021 | $3,950 | $266,900 | $100,400 | $166,500 |
| 2020 | $3,883 | $266,700 | $97,500 | $169,200 |
| 2019 | $3,615 | $255,300 | $95,600 | $159,700 |
| 2018 | $3,416 | $230,500 | $92,700 | $137,800 |
| 2017 | $3,384 | $232,600 | $92,700 | $139,900 |
| 2016 | $3,004 | $202,700 | $86,800 | $115,900 |
| 2015 | $2,724 | $185,200 | $86,800 | $98,400 |
| 2014 | $2,645 | $178,100 | $82,100 | $96,000 |
Source: Public Records
Map
Nearby Homes