Estimated Value: $493,885 - $549,000
3
Beds
2
Baths
1,274
Sq Ft
$412/Sq Ft
Est. Value
About This Home
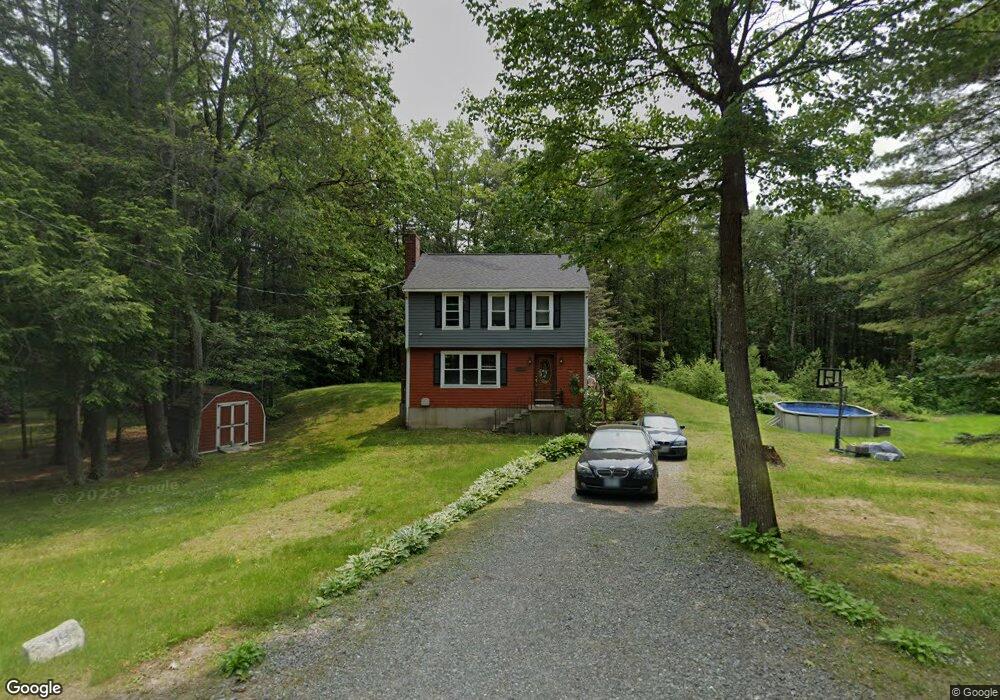
This home is located at 18 Lesley Cir, Derry, NH 03038 and is currently estimated at $524,471, approximately $411 per square foot. 18 Lesley Cir is a home located in Rockingham County with nearby schools including South Range Elementary School, West Running Brook Middle School, and Pinkerton Academy.
Ownership History
Date
Name
Owned For
Owner Type
Purchase Details
Closed on
May 30, 2006
Sold by
Hanley Michael P and Hanley Susan M
Bought by
Jellow John H and Jellow Dawn M
Current Estimated Value
Home Financials for this Owner
Home Financials are based on the most recent Mortgage that was taken out on this home.
Original Mortgage
$81,000
Outstanding Balance
$47,755
Interest Rate
6.62%
Mortgage Type
Unknown
Estimated Equity
$476,717
Create a Home Valuation Report for This Property
The Home Valuation Report is an in-depth analysis detailing your home's value as well as a comparison with similar homes in the area
Home Values in the Area
Average Home Value in this Area
Purchase History
| Date | Buyer | Sale Price | Title Company |
|---|---|---|---|
| Jellow John H | $252,000 | -- |
Source: Public Records
Mortgage History
| Date | Status | Borrower | Loan Amount |
|---|---|---|---|
| Open | Jellow John H | $81,000 | |
| Open | Jellow John H | $201,600 |
Source: Public Records
Tax History
| Year | Tax Paid | Tax Assessment Tax Assessment Total Assessment is a certain percentage of the fair market value that is determined by local assessors to be the total taxable value of land and additions on the property. | Land | Improvement |
|---|---|---|---|---|
| 2024 | $8,061 | $431,300 | $232,000 | $199,300 |
| 2023 | $7,660 | $370,400 | $197,200 | $173,200 |
| 2022 | $7,052 | $370,400 | $197,200 | $173,200 |
| 2021 | $6,712 | $271,100 | $151,100 | $120,000 |
| 2020 | $6,599 | $271,100 | $151,100 | $120,000 |
| 2019 | $5,806 | $222,300 | $102,000 | $120,300 |
| 2018 | $5,706 | $219,200 | $102,000 | $117,200 |
| 2017 | $5,887 | $204,000 | $97,000 | $107,000 |
| 2016 | $5,520 | $204,000 | $97,000 | $107,000 |
| 2015 | $5,589 | $191,200 | $97,000 | $94,200 |
| 2014 | $5,625 | $191,200 | $97,000 | $94,200 |
| 2013 | $5,860 | $186,100 | $95,000 | $91,100 |
Source: Public Records
Map
Nearby Homes
- 13 Kilrea Rd Unit L
- 5 Craven Terrace
- 242 Rockingham Rd
- 106 N Lowell Rd
- 7 Lilac Ridge Rd
- 139 Rockingham Rd Unit 21
- 71 Island Pond Rd
- 8 Blueberry Rd Unit U: R
- 144 Rockingham Rd
- 39 Overton Rd
- 4 Norman Dr Unit L
- 41 Derryfield Rd
- 6 Michael Ave
- 13 Sunnyside Ln Unit L
- 42 Kendall Pond Rd
- 30 Kendall Pond Rd Unit 77
- 30 Kendall Pond Rd Unit 87
- 2 Mulberry St
- 68 Fordway Extension
- 3 Evergreen Way Unit End unit
Your Personal Tour Guide
Ask me questions while you tour the home.