18 Mason St Unit 68 Nashua, NH 03060
Downtown Nashua NeighborhoodEstimated Value: $589,000 - $738,000
7
Beds
5
Baths
3,892
Sq Ft
$174/Sq Ft
Est. Value
About This Home
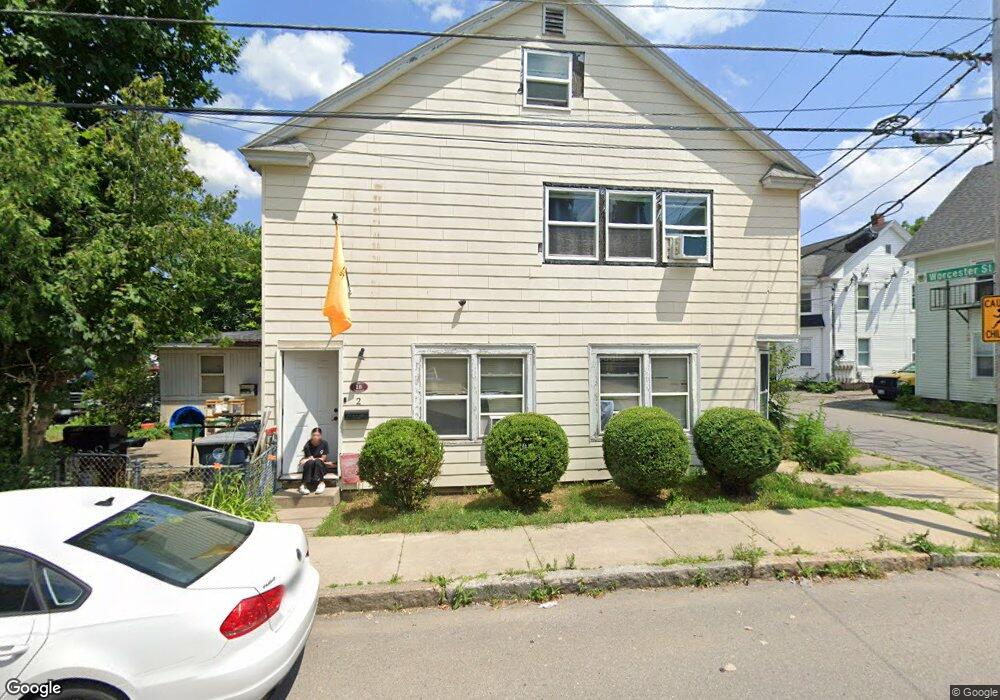
This home is located at 18 Mason St Unit 68, Nashua, NH 03060 and is currently estimated at $677,333, approximately $174 per square foot. 18 Mason St Unit 68 is a home located in Hillsborough County with nearby schools including Amherst Street School, Pennichuck Middle School, and Nashua High School North.
Ownership History
Date
Name
Owned For
Owner Type
Purchase Details
Closed on
Mar 4, 2008
Sold by
Bank Of New York T Co
Bought by
Majauckas Christopher C
Current Estimated Value
Purchase Details
Closed on
Oct 3, 2007
Sold by
Ovalles Leonardo A
Bought by
Bank Of New York T Co
Purchase Details
Closed on
Jul 18, 2006
Sold by
Santos Ricardo M
Bought by
Ovalles Leonardo A
Home Financials for this Owner
Home Financials are based on the most recent Mortgage that was taken out on this home.
Original Mortgage
$325,000
Interest Rate
6.83%
Mortgage Type
Unknown
Purchase Details
Closed on
Apr 6, 2001
Sold by
Monfette Stanley A and Monfette Esther A
Bought by
Santos Ricardo M
Create a Home Valuation Report for This Property
The Home Valuation Report is an in-depth analysis detailing your home's value as well as a comparison with similar homes in the area
Home Values in the Area
Average Home Value in this Area
Purchase History
| Date | Buyer | Sale Price | Title Company |
|---|---|---|---|
| Majauckas Christopher C | $205,200 | -- | |
| Majauckas Christopher C | $205,200 | -- | |
| Bank Of New York T Co | $302,400 | -- | |
| Bank Of New York T Co | $302,400 | -- | |
| Ovalles Leonardo A | $325,000 | -- | |
| Ovalles Leonardo A | $325,000 | -- | |
| Santos Ricardo M | $139,900 | -- | |
| Santos Ricardo M | $139,900 | -- |
Source: Public Records
Mortgage History
| Date | Status | Borrower | Loan Amount |
|---|---|---|---|
| Previous Owner | Santos Ricardo M | $325,000 |
Source: Public Records
Tax History Compared to Growth
Tax History
| Year | Tax Paid | Tax Assessment Tax Assessment Total Assessment is a certain percentage of the fair market value that is determined by local assessors to be the total taxable value of land and additions on the property. | Land | Improvement |
|---|---|---|---|---|
| 2024 | $9,050 | $569,200 | $142,700 | $426,500 |
| 2023 | $8,435 | $462,700 | $114,200 | $348,500 |
| 2022 | $8,361 | $462,700 | $114,200 | $348,500 |
| 2021 | $6,827 | $294,000 | $72,300 | $221,700 |
| 2020 | $4,735 | $294,100 | $72,300 | $221,800 |
| 2019 | $6,400 | $294,100 | $72,300 | $221,800 |
| 2018 | $6,238 | $294,100 | $72,300 | $221,800 |
| 2017 | $4,957 | $192,200 | $69,100 | $123,100 |
| 2016 | $4,818 | $192,200 | $69,100 | $123,100 |
| 2015 | $4,715 | $192,200 | $69,100 | $123,100 |
| 2014 | $4,622 | $192,200 | $69,100 | $123,100 |
Source: Public Records
Map
Nearby Homes
- 18 Mason St Unit 2
- 14 Mason St
- 8 Worcester St Unit 71
- 20 Mason St
- 3 Worcester St Unit 1
- 3 Worcester St
- 1 Worcester St
- 9 Mason St Unit 11
- 9-11 Mason St
- 10 Mason St Unit 12
- 13 Mason St
- 13 Mason St
- 6-8 Mason St
- 5 White Ave Unit 73
- 5 1/2 Worcester St
- 10 Worcester St
- 15 Mason St
- 55 Worcester St Unit 57
- 14 White Ave Unit 16
- 5 Mason St