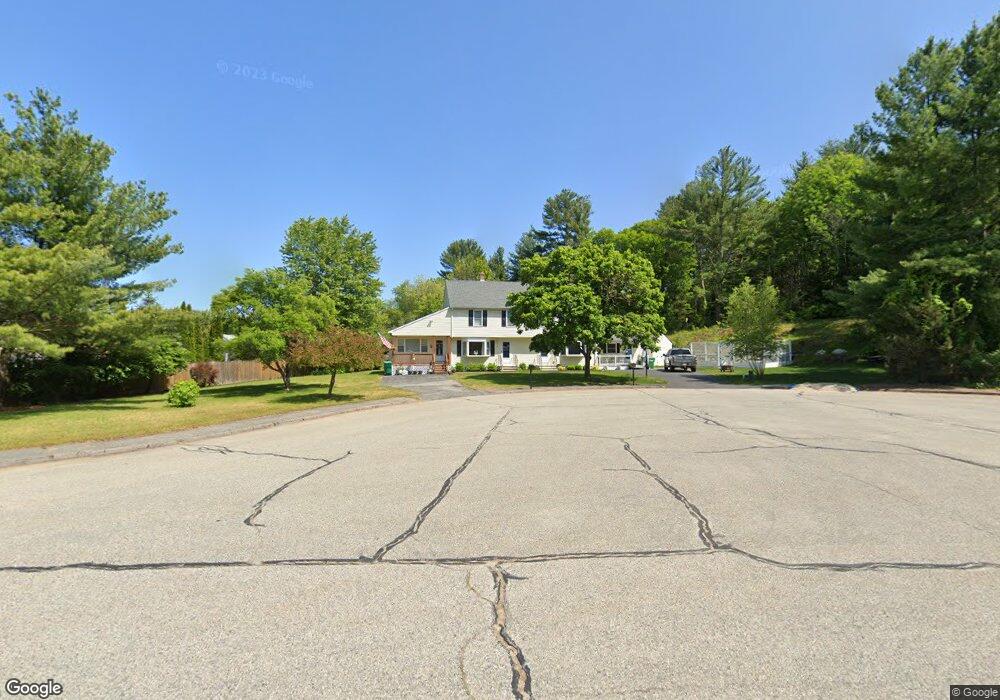
18 Meadow Rd Uxbridge, MA 01569
Estimated Value: $447,747 - $500,000
2
Beds
2
Baths
1,351
Sq Ft
$347/Sq Ft
Est. Value
About This Home
This home is located at 18 Meadow Rd, Uxbridge, MA 01569 and is currently estimated at $468,687, approximately $346 per square foot. 18 Meadow Rd is a home located in Worcester County with nearby schools including Uxbridge High School, Our Lady of the Valley Regional School, and Whitinsville Christian School.
Ownership History
Date
Name
Owned For
Owner Type
Purchase Details
Closed on
Aug 11, 2017
Sold by
Bank New York Mellon T
Bought by
Edsall Betty A
Current Estimated Value
Purchase Details
Closed on
Dec 7, 2016
Sold by
Plante Jessica
Bought by
Bank New York Mellon T
Purchase Details
Closed on
Apr 9, 2010
Sold by
Plante Jessica and Plante Richard
Bought by
Plante Jessica
Purchase Details
Closed on
Oct 31, 2005
Sold by
Snyder Sherri E
Bought by
Plante Jessica and Plante Richard
Home Financials for this Owner
Home Financials are based on the most recent Mortgage that was taken out on this home.
Original Mortgage
$215,120
Interest Rate
5.79%
Mortgage Type
Purchase Money Mortgage
Purchase Details
Closed on
Oct 5, 1998
Sold by
Connors Elizabeth S
Bought by
Snyder Sherri E
Purchase Details
Closed on
Mar 6, 1992
Sold by
Audet Bros Inc
Bought by
Connors Eliazabeth
Create a Home Valuation Report for This Property
The Home Valuation Report is an in-depth analysis detailing your home's value as well as a comparison with similar homes in the area
Home Values in the Area
Average Home Value in this Area
Purchase History
| Date | Buyer | Sale Price | Title Company |
|---|---|---|---|
| Edsall Betty A | $166,200 | -- | |
| Bank New York Mellon T | $172,000 | -- | |
| Plante Jessica | -- | -- | |
| Plante Jessica | $268,900 | -- | |
| Snyder Sherri E | $101,900 | -- | |
| Connors Eliazabeth | $89,900 | -- |
Source: Public Records
Mortgage History
| Date | Status | Borrower | Loan Amount |
|---|---|---|---|
| Previous Owner | Plante Jessica | $215,120 | |
| Previous Owner | Connors Eliazabeth | $20,000 | |
| Previous Owner | Connors Eliazabeth | $121,000 | |
| Previous Owner | Connors Eliazabeth | $60,000 |
Source: Public Records
Tax History Compared to Growth
Tax History
| Year | Tax Paid | Tax Assessment Tax Assessment Total Assessment is a certain percentage of the fair market value that is determined by local assessors to be the total taxable value of land and additions on the property. | Land | Improvement |
|---|---|---|---|---|
| 2025 | $55 | $418,900 | $0 | $418,900 |
| 2024 | $4,562 | $353,100 | $0 | $353,100 |
| 2023 | $4,022 | $288,300 | $0 | $288,300 |
| 2022 | $3,889 | $256,500 | $0 | $256,500 |
| 2021 | $3,643 | $230,300 | $0 | $230,300 |
| 2020 | $4,205 | $251,200 | $0 | $251,200 |
| 2019 | $4,358 | $251,200 | $0 | $251,200 |
| 2018 | $4,305 | $250,700 | $0 | $250,700 |
| 2017 | $3,153 | $185,900 | $0 | $185,900 |
| 2016 | $3,171 | $180,500 | $0 | $180,500 |
| 2015 | $3,069 | $176,400 | $0 | $176,400 |
Source: Public Records
Map
Nearby Homes
- 14 Woodland Rd
- 371 Hartford Ave E
- 20 Nature View Dr Unit 20
- 46 Pouts Ln Unit 46
- 24 Olde Canal Way Unit 24
- 256 Mendon St
- 107 Henry St
- 37 Elizabeth St
- 72 Homeward Ave
- 50 Carrington Ln
- 3 Strathmore Shire Unit A
- 75 Lake St
- 48 Homeward Ave
- 113 Rogerson Crossing Unit 113
- 44 Arthur Dr Unit 44
- 0 Louis St
- 307 N Main St
- 35 Highland Park Unit 35
- 36 Elm St
- 24 Road Ahr