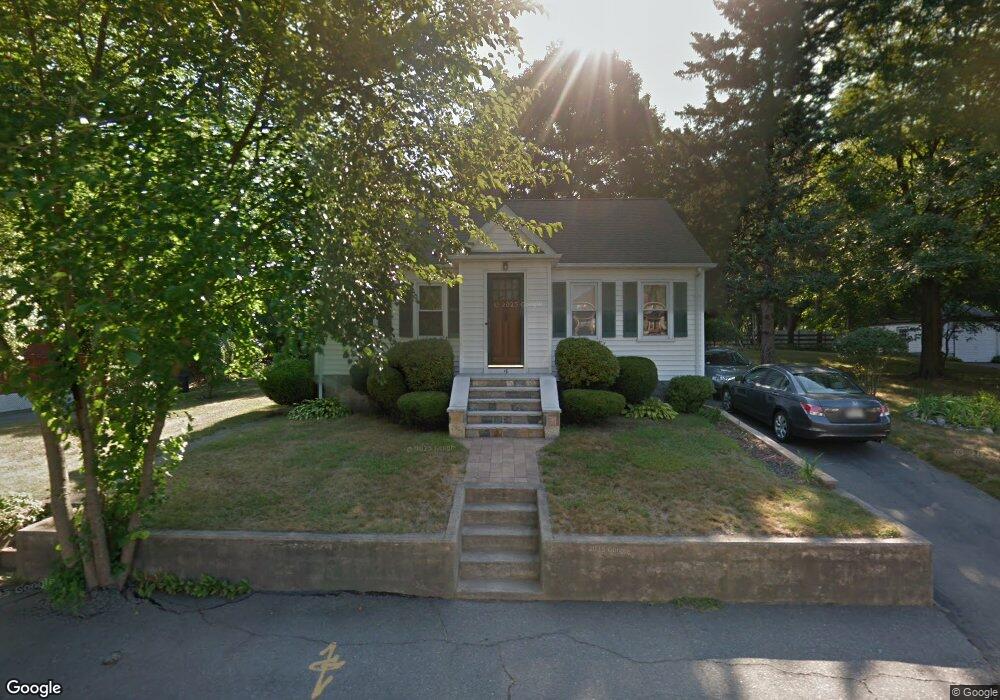
18 Mount Vernon St Quincy, MA 02169
Quincy Center NeighborhoodEstimated Value: $613,000 - $650,000
2
Beds
1
Bath
884
Sq Ft
$715/Sq Ft
Est. Value
About This Home
This home is located at 18 Mount Vernon St, Quincy, MA 02169 and is currently estimated at $632,105, approximately $715 per square foot. 18 Mount Vernon St is a home located in Norfolk County with nearby schools including Charles A. Bernazzani Elementary School, Central Middle School, and Quincy High School.
Ownership History
Date
Name
Owned For
Owner Type
Purchase Details
Closed on
Jun 21, 2002
Sold by
Mah Tsz L
Bought by
Carchidi Peter C
Current Estimated Value
Home Financials for this Owner
Home Financials are based on the most recent Mortgage that was taken out on this home.
Original Mortgage
$232,400
Outstanding Balance
$98,264
Interest Rate
6.81%
Mortgage Type
Purchase Money Mortgage
Estimated Equity
$533,841
Purchase Details
Closed on
Nov 8, 2001
Sold by
Mahoney Anna O
Bought by
Mah Tsz L
Home Financials for this Owner
Home Financials are based on the most recent Mortgage that was taken out on this home.
Original Mortgage
$188,000
Interest Rate
6.77%
Mortgage Type
Purchase Money Mortgage
Create a Home Valuation Report for This Property
The Home Valuation Report is an in-depth analysis detailing your home's value as well as a comparison with similar homes in the area
Home Values in the Area
Average Home Value in this Area
Purchase History
| Date | Buyer | Sale Price | Title Company |
|---|---|---|---|
| Carchidi Peter C | $290,500 | -- | |
| Mah Tsz L | $235,000 | -- |
Source: Public Records
Mortgage History
| Date | Status | Borrower | Loan Amount |
|---|---|---|---|
| Open | Carchidi Peter C | $232,400 | |
| Previous Owner | Mah Tsz L | $188,000 |
Source: Public Records
Tax History Compared to Growth
Tax History
| Year | Tax Paid | Tax Assessment Tax Assessment Total Assessment is a certain percentage of the fair market value that is determined by local assessors to be the total taxable value of land and additions on the property. | Land | Improvement |
|---|---|---|---|---|
| 2025 | $6,064 | $525,900 | $316,700 | $209,200 |
| 2024 | $5,740 | $509,300 | $301,900 | $207,400 |
| 2023 | $5,640 | $506,700 | $287,800 | $218,900 |
| 2022 | $5,244 | $437,700 | $231,100 | $206,600 |
| 2021 | $5,220 | $430,000 | $231,100 | $198,900 |
| 2020 | $5,208 | $419,000 | $231,100 | $187,900 |
| 2019 | $4,901 | $390,500 | $224,600 | $165,900 |
| 2018 | $4,880 | $365,800 | $208,300 | $157,500 |
| 2017 | $4,714 | $332,700 | $198,600 | $134,100 |
| 2016 | $4,410 | $307,100 | $181,000 | $126,100 |
| 2015 | $4,193 | $287,200 | $171,000 | $116,200 |
| 2014 | $3,996 | $268,900 | $171,000 | $97,900 |
Source: Public Records
Map
Nearby Homes
- 73 Connell St
- 10 White St
- 1 Cityview Ln Unit 506
- 1 Cityview Ln Unit 210
- 1 Cityview Ln Unit 709
- 25 Carrolls Ln
- 89 Puritan Dr
- 211 Copeland St
- 41 Wallace Rd
- 121 Hillside Ave
- 66 Unity St
- 60 Pond St
- 11 Rockwell Ave
- 46 Suomi Rd
- 46 Suomi Rd Unit 46
- 46-48 Buckley St
- 57 Buckley St
- 171 Milton St
- 29 Oconnell Ave
- 169 Pine St
- 26 Mount Vernon St
- 10 Mount Vernon St
- 5 Garrett Dr
- 5 Garrett Dr Unit 1
- 17 Mount Vernon St
- 30 Mount Vernon St
- 9 Mount Vernon St
- 23 Mount Vernon St
- 3 Garrett Dr
- 55 Jenness St
- 51 Jenness St
- 65 Common St
- 45 Jenness St
- 27 Mount Vernon St
- 34 Mount Vernon St
- 65 Jenness St Unit 65
- 67 Jenness St Unit 1
- 61 Jenness St
- 41 Jenness St
- 395 Quarry St