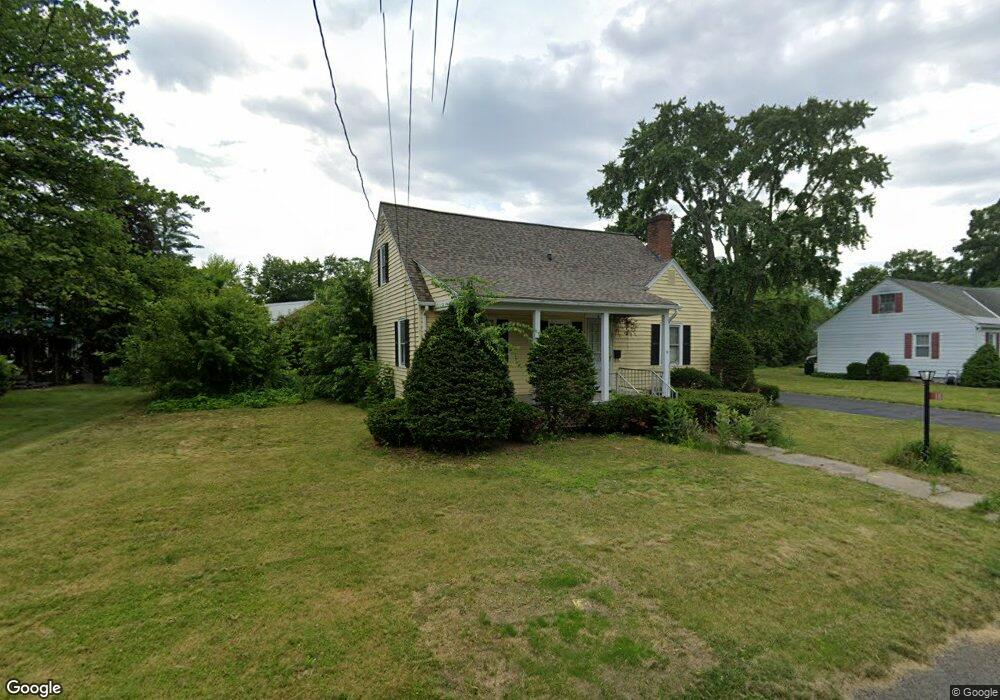
18 Mutter St Easthampton, MA 01027
Estimated Value: $420,433 - $450,000
4
Beds
2
Baths
1,613
Sq Ft
$267/Sq Ft
Est. Value
About This Home
This home is located at 18 Mutter St, Easthampton, MA 01027 and is currently estimated at $430,108, approximately $266 per square foot. 18 Mutter St is a home located in Hampshire County with nearby schools including Easthampton High School, Tri-County Schools, and New England Adolescent Research Institute.
Ownership History
Date
Name
Owned For
Owner Type
Purchase Details
Closed on
Apr 30, 2008
Sold by
Pauline E Oborne Ft and Oborne Pauline E
Bought by
Peterson Susan W
Current Estimated Value
Home Financials for this Owner
Home Financials are based on the most recent Mortgage that was taken out on this home.
Original Mortgage
$60,000
Outstanding Balance
$38,216
Interest Rate
5.99%
Mortgage Type
Purchase Money Mortgage
Estimated Equity
$391,892
Purchase Details
Closed on
Jan 16, 2008
Sold by
Oborne Pauline E
Bought by
Pauline E Oborne Ft and Oborne Pauline E
Create a Home Valuation Report for This Property
The Home Valuation Report is an in-depth analysis detailing your home's value as well as a comparison with similar homes in the area
Home Values in the Area
Average Home Value in this Area
Purchase History
| Date | Buyer | Sale Price | Title Company |
|---|---|---|---|
| Peterson Susan W | $232,500 | -- | |
| Pauline E Oborne Ft | -- | -- |
Source: Public Records
Mortgage History
| Date | Status | Borrower | Loan Amount |
|---|---|---|---|
| Open | Peterson Susan W | $60,000 |
Source: Public Records
Tax History
| Year | Tax Paid | Tax Assessment Tax Assessment Total Assessment is a certain percentage of the fair market value that is determined by local assessors to be the total taxable value of land and additions on the property. | Land | Improvement |
|---|---|---|---|---|
| 2025 | $4,686 | $342,800 | $105,900 | $236,900 |
| 2024 | $4,528 | $333,900 | $102,800 | $231,100 |
| 2023 | $3,616 | $246,800 | $81,200 | $165,600 |
| 2022 | $4,080 | $246,800 | $81,200 | $165,600 |
| 2021 | $4,285 | $244,300 | $81,200 | $163,100 |
| 2020 | $4,383 | $246,800 | $81,200 | $165,600 |
| 2019 | $3,672 | $237,500 | $81,200 | $156,300 |
| 2018 | $3,550 | $221,900 | $76,500 | $145,400 |
| 2017 | $3,474 | $214,300 | $73,600 | $140,700 |
| 2016 | $3,494 | $224,100 | $73,600 | $150,500 |
| 2015 | $3,395 | $224,100 | $73,600 | $150,500 |
Source: Public Records
Map
Nearby Homes
- 40 Clark St
- 4 Gaugh St
- 2 Oak St
- 33 Knipfer Ave
- 19 Nicols Way Unit 19
- 7 Union Ct
- 12 Glen Cove Place Unit B
- 10 Glen Cove Place Unit A
- 18-20 Oakdale Place
- 29 Parsons St Unit 1
- 6 Wilton Rd
- 6 S St & Abutting Lots
- 11 Dragon Cir
- 41 South St Unit 11
- 36 & 36R Holly Cir
- 2 W Park Dr
- 336 Main St
- 385 Main St
- M143 &152 Glendale St
- 211 East St Unit 11
Your Personal Tour Guide
Ask me questions while you tour the home.