Estimated Value: $49,000 - $148,000
4
Beds
1
Bath
1,387
Sq Ft
$56/Sq Ft
Est. Value
About This Home
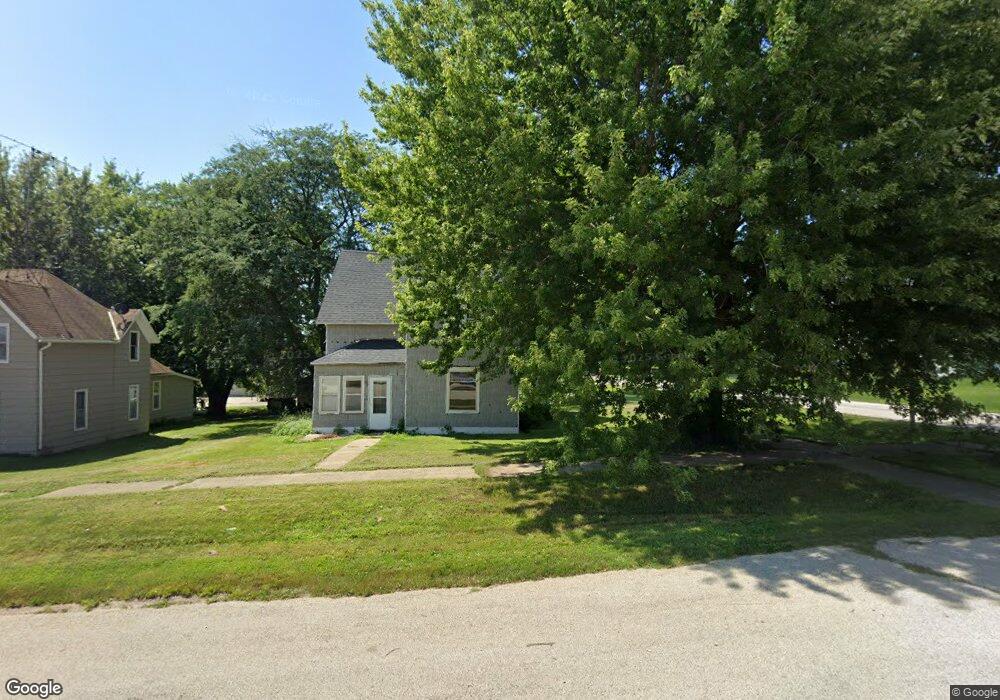
This home is located at 18 N Orchard St, Kiron, IA 51448 and is currently estimated at $78,102, approximately $56 per square foot. 18 N Orchard St is a home with nearby schools including Denison Elementary School, Broadway Elementary School, and Denison Middle School.
Ownership History
Date
Name
Owned For
Owner Type
Purchase Details
Closed on
Oct 6, 2020
Sold by
Ogren Trust
Bought by
Johnson Anthony and Johnson Mandi
Current Estimated Value
Home Financials for this Owner
Home Financials are based on the most recent Mortgage that was taken out on this home.
Original Mortgage
$33,000
Outstanding Balance
$29,285
Interest Rate
2.9%
Mortgage Type
Seller Take Back
Estimated Equity
$48,817
Purchase Details
Closed on
Jun 14, 2012
Sold by
Mormillo Kathryn Noelle
Bought by
City Of Kiron
Purchase Details
Closed on
Apr 30, 2012
Sold by
The Estate Of Timothy Vincent Ferranti S and Mormillo Kathyrn Noelle
Bought by
City Of Kiron
Create a Home Valuation Report for This Property
The Home Valuation Report is an in-depth analysis detailing your home's value as well as a comparison with similar homes in the area
Home Values in the Area
Average Home Value in this Area
Purchase History
| Date | Buyer | Sale Price | Title Company |
|---|---|---|---|
| Johnson Anthony | $33,000 | None Available | |
| City Of Kiron | -- | None Available | |
| City Of Kiron | -- | None Available |
Source: Public Records
Mortgage History
| Date | Status | Borrower | Loan Amount |
|---|---|---|---|
| Open | Johnson Anthony | $33,000 |
Source: Public Records
Tax History Compared to Growth
Tax History
| Year | Tax Paid | Tax Assessment Tax Assessment Total Assessment is a certain percentage of the fair market value that is determined by local assessors to be the total taxable value of land and additions on the property. | Land | Improvement |
|---|---|---|---|---|
| 2025 | $442 | $30,390 | $3,300 | $27,090 |
| 2024 | $442 | $28,910 | $3,300 | $25,610 |
| 2023 | $296 | $24,280 | $3,300 | $20,980 |
| 2022 | $3 | $15,830 | $2,700 | $13,130 |
| 2021 | $244 | $15,060 | $2,700 | $12,360 |
| 2020 | $246 | $13,120 | $2,700 | $10,420 |
| 2019 | $254 | $12,990 | $0 | $0 |
| 2018 | $290 | $15,230 | $2,700 | $12,530 |
| 2017 | $166 | $15,230 | $2,700 | $12,530 |
| 2016 | $170 | $17,020 | $0 | $0 |
| 2015 | $170 | $17,040 | $0 | $0 |
| 2014 | $160 | $17,040 | $0 | $0 |
Source: Public Records
Map
Nearby Homes