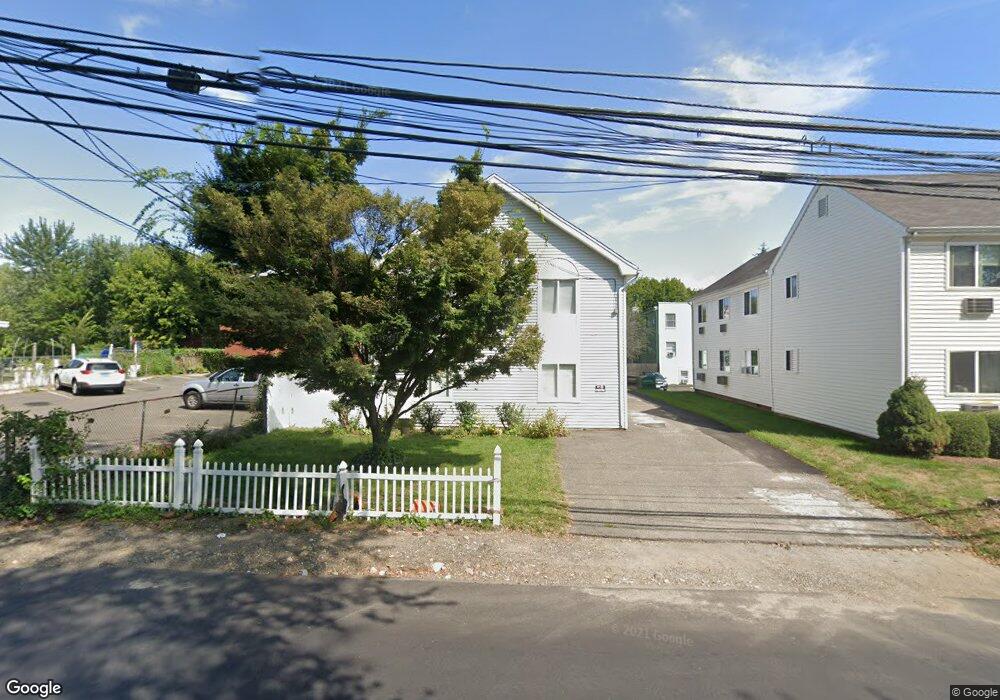
18 N Taylor Ave Unit 1 Norwalk, CT 06854
Spring Hill NeighborhoodEstimated Value: $304,000 - $368,000
2
Beds
2
Baths
756
Sq Ft
$441/Sq Ft
Est. Value
About This Home
This home is located at 18 N Taylor Ave Unit 1, Norwalk, CT 06854 and is currently estimated at $333,303, approximately $440 per square foot. 18 N Taylor Ave Unit 1 is a home located in Fairfield County with nearby schools including Kendall Elementary School, Ponus Ridge Middle School, and Brien Mcmahon High School.
Ownership History
Date
Name
Owned For
Owner Type
Purchase Details
Closed on
Dec 22, 2017
Sold by
Doronila Reina
Bought by
Doronila Joby and Doronila Reina
Current Estimated Value
Home Financials for this Owner
Home Financials are based on the most recent Mortgage that was taken out on this home.
Original Mortgage
$164,000
Outstanding Balance
$83,681
Interest Rate
3.9%
Mortgage Type
New Conventional
Estimated Equity
$249,622
Purchase Details
Closed on
May 16, 2005
Sold by
Singh Rakesh K and Singh Rekha
Bought by
Doronila Reina Magallane
Home Financials for this Owner
Home Financials are based on the most recent Mortgage that was taken out on this home.
Original Mortgage
$196,800
Interest Rate
5.37%
Purchase Details
Closed on
Aug 10, 1987
Sold by
Forcellina Robert
Bought by
Singh Rakesh
Create a Home Valuation Report for This Property
The Home Valuation Report is an in-depth analysis detailing your home's value as well as a comparison with similar homes in the area
Home Values in the Area
Average Home Value in this Area
Purchase History
| Date | Buyer | Sale Price | Title Company |
|---|---|---|---|
| Doronila Joby | -- | -- | |
| Doronila Joby | -- | -- | |
| Doronila Reina Magallane | $246,000 | -- | |
| Doronila Reina Magallane | $246,000 | -- | |
| Singh Rakesh | $150,000 | -- |
Source: Public Records
Mortgage History
| Date | Status | Borrower | Loan Amount |
|---|---|---|---|
| Open | Singh Rakesh | $164,000 | |
| Previous Owner | Singh Rakesh | $196,800 | |
| Previous Owner | Singh Rakesh | $36,900 |
Source: Public Records
Tax History Compared to Growth
Tax History
| Year | Tax Paid | Tax Assessment Tax Assessment Total Assessment is a certain percentage of the fair market value that is determined by local assessors to be the total taxable value of land and additions on the property. | Land | Improvement |
|---|---|---|---|---|
| 2025 | $3,756 | $158,210 | $0 | $158,210 |
| 2024 | $3,698 | $158,210 | $0 | $158,210 |
| 2023 | $2,948 | $118,080 | $0 | $118,080 |
| 2022 | $2,902 | $118,080 | $0 | $118,080 |
| 2021 | $2,469 | $118,080 | $0 | $118,080 |
| 2020 | $2,787 | $118,080 | $0 | $118,080 |
| 2019 | $2,752 | $118,080 | $0 | $118,080 |
| 2018 | $3,152 | $121,560 | $0 | $121,560 |
| 2017 | $3,042 | $121,560 | $0 | $121,560 |
| 2016 | $3,092 | $121,560 | $0 | $121,560 |
| 2015 | $2,778 | $121,560 | $0 | $121,560 |
| 2014 | $3,044 | $121,560 | $0 | $121,560 |
Source: Public Records
Map
Nearby Homes
- 14 Ferris Ave Unit 9
- 63 Ferris Ave
- 29 Nash Place
- 8 Crown Ave
- 42 Stuart Ave Unit A1
- 1 Horizon Dr Unit 2
- 146 Gillies Ln Unit 146
- 59 Taylor Ave
- 2 Finley St
- 10 Ledgebrook Dr Unit 1
- 51 1/2 Magnolia Ave
- 14 Windward Rd
- 6 W Couch St
- 3 Wynne Rd
- 47 Taylor Ave
- 45 Maple St Unit 4H
- 50 Fairview Ave Unit 4J
- 50 Fairview Ave Unit 1C
- 39 Chatham Dr
- 46 Prospect Ave Unit 2H
- 18 N Taylor Ave Unit 4
- 18 N Taylor Ave Unit 3
- 18 N Taylor Ave Unit 2
- 20 N Taylor Ave
- 22 N Taylor Ave
- 24 N Taylor Ave
- 12 N Taylor Ave Unit 31
- 12 N Taylor Ave Unit 28
- 12 N Taylor Ave Unit 35
- 17 N Taylor Ave
- 19 N Taylor Ave
- 26 N Taylor Ave
- 15 N Taylor Ave
- 21 N Taylor Ave
- 10 N Taylor Ave
- 13 N Taylor Ave
- 23 N Taylor Ave
- 23 N Taylor Ave Unit 2
- 23 N Taylor Ave Unit 1
- 11 N Taylor Ave