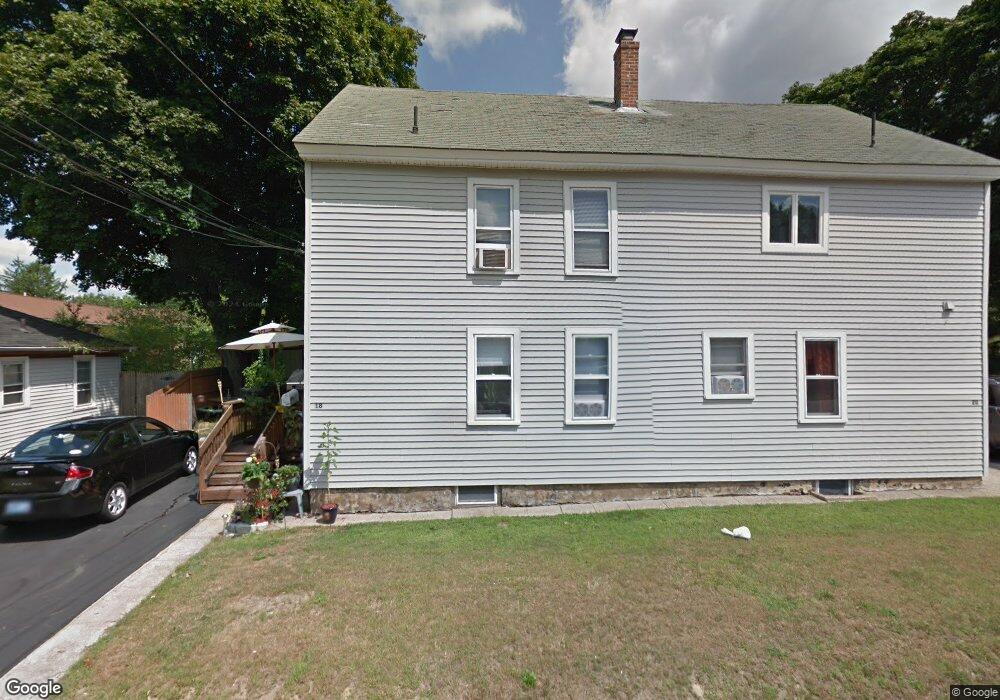
18 Nestor St West Warwick, RI 02893
Centreville NeighborhoodEstimated Value: $477,000 - $523,000
4
Beds
3
Baths
2,296
Sq Ft
$219/Sq Ft
Est. Value
About This Home
This home is located at 18 Nestor St, West Warwick, RI 02893 and is currently estimated at $503,810, approximately $219 per square foot. 18 Nestor St is a home located in Kent County with nearby schools including West Warwick High School.
Ownership History
Date
Name
Owned For
Owner Type
Purchase Details
Closed on
May 24, 2012
Sold by
Gosselin Roland and Gosselin Tammy L
Bought by
Gosselin Roland
Current Estimated Value
Home Financials for this Owner
Home Financials are based on the most recent Mortgage that was taken out on this home.
Original Mortgage
$154,530
Outstanding Balance
$21,432
Interest Rate
3.5%
Mortgage Type
FHA
Estimated Equity
$482,378
Create a Home Valuation Report for This Property
The Home Valuation Report is an in-depth analysis detailing your home's value as well as a comparison with similar homes in the area
Home Values in the Area
Average Home Value in this Area
Purchase History
| Date | Buyer | Sale Price | Title Company |
|---|---|---|---|
| Gosselin Roland | -- | -- |
Source: Public Records
Mortgage History
| Date | Status | Borrower | Loan Amount |
|---|---|---|---|
| Open | Gosselin Roland | $154,530 | |
| Previous Owner | Gosselin Roland | $157,712 | |
| Previous Owner | Gosselin Roland | $149,300 |
Source: Public Records
Tax History Compared to Growth
Tax History
| Year | Tax Paid | Tax Assessment Tax Assessment Total Assessment is a certain percentage of the fair market value that is determined by local assessors to be the total taxable value of land and additions on the property. | Land | Improvement |
|---|---|---|---|---|
| 2025 | $6,795 | $475,500 | $85,500 | $390,000 |
| 2024 | $5,714 | $305,700 | $54,300 | $251,400 |
| 2023 | $5,600 | $305,700 | $54,300 | $251,400 |
| 2022 | $6,038 | $305,700 | $54,300 | $251,400 |
| 2021 | $6,232 | $208,500 | $44,600 | $163,900 |
| 2020 | $4,796 | $208,500 | $44,600 | $163,900 |
| 2019 | $6,113 | $208,500 | $44,600 | $163,900 |
| 2018 | $6,546 | $167,000 | $41,900 | $125,100 |
| 2017 | $6,338 | $167,000 | $41,900 | $125,100 |
| 2016 | $6,205 | $166,500 | $41,900 | $124,600 |
| 2015 | $5,971 | $160,200 | $41,900 | $118,300 |
| 2014 | $5,839 | $160,200 | $41,900 | $118,300 |
Source: Public Records
Map
Nearby Homes
- 25 School St
- 3 June Ct
- 2 Teresa Ann Crossing
- 8 Teresa Ann Crossing
- 4 Teresa Ann Crossing
- 6 Teresa Ann Crossing
- 94 Cowesett Ave Unit 8
- 34 Buckley Ave
- 40 E Greenwich Ave
- 54 Arthur St
- 170 Cowesett Ave
- 177 Cowesett Ave
- 38 New London Ave
- 25 Fawn Ln
- 39 Matteson Ave
- 16 Ontario St
- 5 Cottage St
- 194 Kimberly Ln
- 64 Lockwood St
- 125 Setian Ln
- 16 Nestor St
- 0 Pennsylvania Ave
- 1 Fountain St
- 15 Nestor St Unit 4
- 15 Nestor St Unit 4
- 22 Nestor St
- 10 Nestor St
- 25 Nestor St
- 5 Fountain St
- 5 Fountain St Unit 1
- 24 Nestor St
- 13 Pennsylvania Ave
- 11 Nestor St
- 2 Fountain St
- 9 Fountain St
- 1606 Main St
- 9 Nestor St
- 10 Pennsylvania Ave
- 58 Church St
- 8 Fountain St