Estimated Value: $240,000 - $253,000
3
Beds
3
Baths
1,514
Sq Ft
$164/Sq Ft
Est. Value
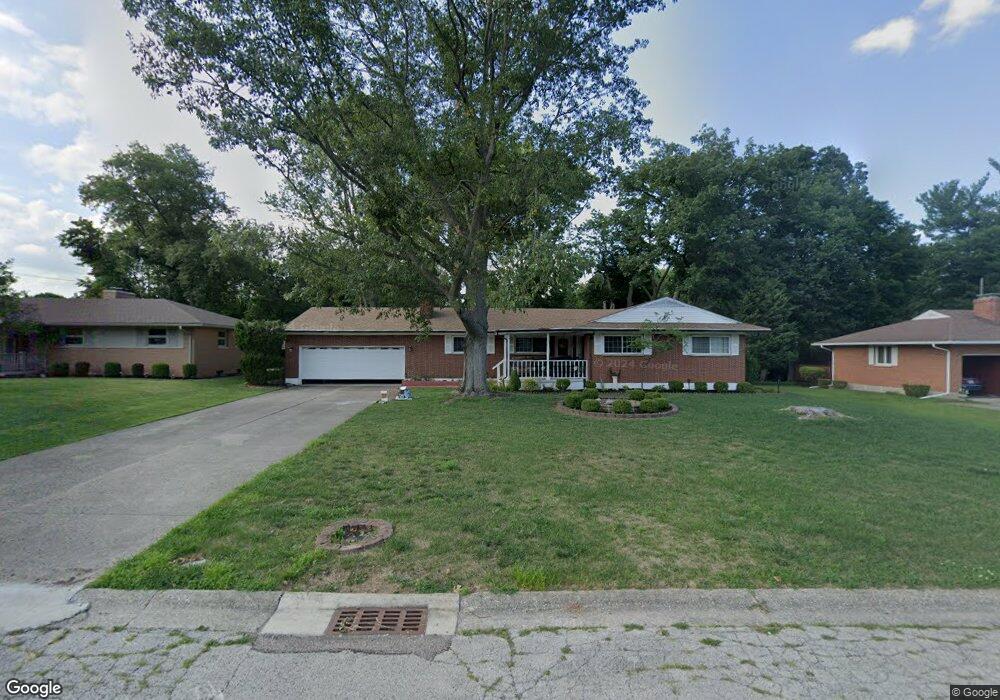
About This Home
This home is located at 18 Omega Dr, Piqua, OH 45356 and is currently estimated at $248,515, approximately $164 per square foot. 18 Omega Dr is a home located in Miami County with nearby schools including Washington Primary School, Piqua Junior High School, and Piqua High School.
Ownership History
Date
Name
Owned For
Owner Type
Purchase Details
Closed on
Jan 21, 2009
Sold by
Liette Jean and Liette Edwin
Bought by
Estrada Aracely
Current Estimated Value
Home Financials for this Owner
Home Financials are based on the most recent Mortgage that was taken out on this home.
Original Mortgage
$137,169
Outstanding Balance
$87,899
Interest Rate
5.44%
Mortgage Type
FHA
Estimated Equity
$160,616
Purchase Details
Closed on
Aug 2, 2006
Sold by
Teague Robert W
Bought by
Liette Jean and Liette Edwin
Purchase Details
Closed on
Oct 12, 2001
Sold by
Fifth Third Bank Of Western Ohio and Kunkel Faye Kathleen
Bought by
Teague Robert W
Home Financials for this Owner
Home Financials are based on the most recent Mortgage that was taken out on this home.
Original Mortgage
$106,080
Interest Rate
6.99%
Mortgage Type
VA
Purchase Details
Closed on
Jan 1, 1990
Bought by
Kunkel Faye Kathleen
Create a Home Valuation Report for This Property
The Home Valuation Report is an in-depth analysis detailing your home's value as well as a comparison with similar homes in the area
Home Values in the Area
Average Home Value in this Area
Purchase History
| Date | Buyer | Sale Price | Title Company |
|---|---|---|---|
| Estrada Aracely | $140,000 | -- | |
| Liette Jean | $78,536 | -- | |
| Teague Robert W | $104,000 | -- | |
| Kunkel Faye Kathleen | -- | -- |
Source: Public Records
Mortgage History
| Date | Status | Borrower | Loan Amount |
|---|---|---|---|
| Open | Teague Robert W | $137,169 | |
| Previous Owner | Teague Robert W | $106,080 |
Source: Public Records
Tax History Compared to Growth
Tax History
| Year | Tax Paid | Tax Assessment Tax Assessment Total Assessment is a certain percentage of the fair market value that is determined by local assessors to be the total taxable value of land and additions on the property. | Land | Improvement |
|---|---|---|---|---|
| 2024 | $2,568 | $62,480 | $14,460 | $48,020 |
| 2023 | $2,568 | $62,480 | $14,460 | $48,020 |
| 2022 | $2,612 | $62,480 | $14,460 | $48,020 |
| 2021 | $2,380 | $52,050 | $12,040 | $40,010 |
| 2020 | $2,332 | $52,050 | $12,040 | $40,010 |
| 2019 | $2,345 | $52,050 | $12,040 | $40,010 |
| 2018 | $2,142 | $45,400 | $12,040 | $33,360 |
| 2017 | $2,168 | $45,400 | $12,040 | $33,360 |
| 2016 | $2,144 | $45,400 | $12,040 | $33,360 |
| 2015 | $2,194 | $45,400 | $12,040 | $33,360 |
| 2014 | $2,194 | $45,400 | $12,040 | $33,360 |
| 2013 | $2,201 | $45,400 | $12,040 | $33,360 |
Source: Public Records
Map
Nearby Homes